Figures & data
Figure 1. BALF total and differential cell counts. Data shown represent mean ± SE. (§) indicates significant differences compared to HBSS, BSA, HB/MY, HB/IN; or (≠) compared to HBSS, BSA, HB/MY only. Letter (A = MACA, C = CON, I = IND, M = MYC) identifies differences among treatments: at p < 0.05. n = 6.
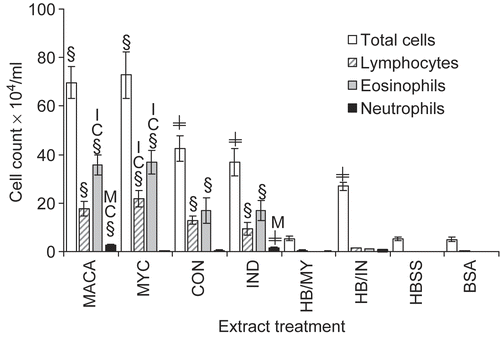
Figure 2. (A) Serum and BALF total IgE. (B) BALF total IgA. (C) Antigen-specific IgE quantified in functional assay by measurement of mast cell mediator (β-hexosaminidase) release and presented as percent of total mediator release. Data shown represent mean ± SE. Significantly elevated compared to (§) all controls; (#) to other treatments; (≠) HBSS and BSA at p < 0.05. n = 6.
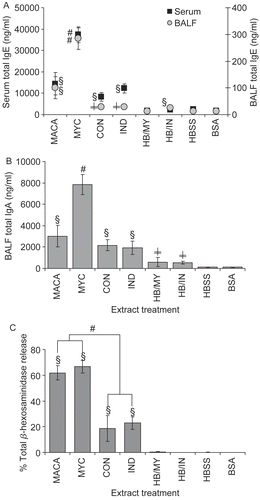
Figure 3. (A) Immediate respiratory physiological responses averaged for 1 hr immediately following IA extract exposure. (B) Respiratory responses to increasing concentrations of methacholine aerosol at D1 and D3 after final IA exposure. Data shown represent mean ± SE. Significantly elevated compared to (#) HBSS and/or BSA; (§) all controls; (≠) all treatments; other treatments: C = CON, I = IND, M = MYC, A = MACA at p < 0.05. n = 6.
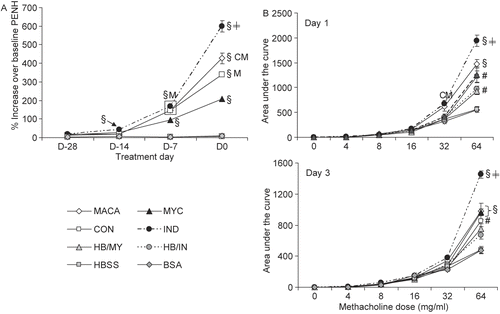
Table 1. Summary of incidence and severity of mouse lung pathology.
Figure 4. (A) The neurotrophins NGF, NT-3 and NT-4 in BALF were assayed by ELISA. The limit of detection was 15.6 pg/ml for NGF, 4.7 pg/ml for both NT-3, and NT-4. Data shown represent mean ± SE. Significantly elevated compared to (§) all controls; (≠) HBSS and/or BSA; other extracts: C = CON, I = IND, M = MYC, A = MACA at p < 0.05. n = 6. (B) Protease activity is shown as percent of trypsin control.
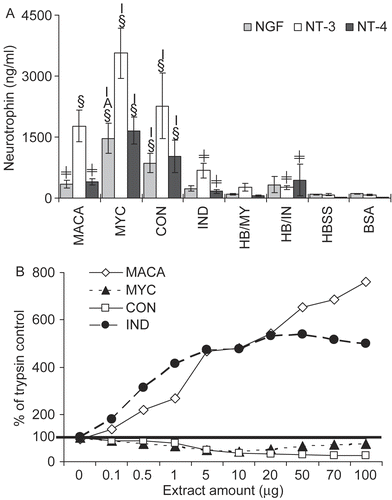
Figure 5 A Western blot of MACA and M. anisopliae component extracts were probed with mouse anti-MACA hyperimmune serum and HRP-labeled rat anti-mouse IgE to identify extract proteins that bind IgE.
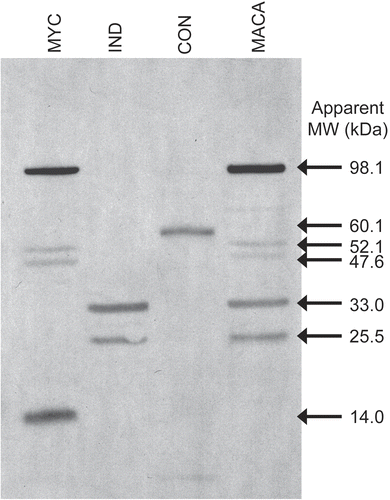
Table 2. Response summary table.