Figures & data
Table 1. Exposure protocol and overview over statistical main effects, exposure groups and tissue/data collection.
Figure 1. Effects on inhalation of air (AIR), ozone (O3), limonene (LIM) or limonene/O3 reaction products (MIX) on Day 29 in allergic and naïve mice. Mice were exposed to laboratory air during the 15 min baseline period, followed by 60 min of exposure to AIR, O3, LIM or MIX. Daily exposures were performed on Days 27–29. The respiratory parameter Time of brake is shown for AIR- and O3-exposed mice (A) and for AIR- and MIX-exposed mice (B). Tidal volume is shown for AIR- and O3-exposed mice (C). Mean values (n = 5 mice/group) of 1 min periods are shown. Statistical analyses are reported in the text.
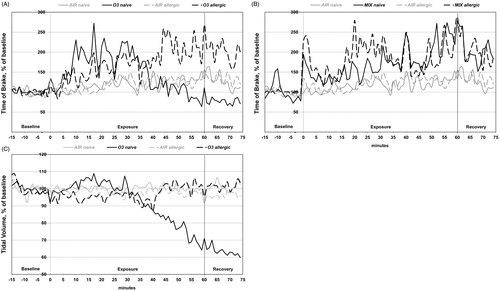
Table 2. Effects on minute volume per gram on day 29 during the exposure period 51–60 min.
Figure 2. Naïve and allergic mice were exposed to AIR, O3, LIM or MIX for 60 min on Days 27–29. OVA-specific IgE was measured in serum (A) before (Day 26) and (B) after (Day 30) exposure. (C) Day 30 OVA-specific IgG1. Bars represent mean ± SEM of 5 mice/group. Results of two-way ANOVA are given above figures.
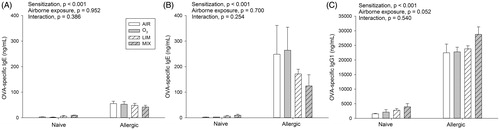
Figure 3. Naïve and allergic mice were exposed to AIR, O3, LIM and MIX for 60 min on Days 27–29 and total number of (A) eosinophils, (B) lymphocytes and (C) neutrophils in BALF analyzed on Day 30. (D) Protein levels in BALF and (E) IL-5 levels in lung homogenates on Day 30. Bars represent mean ± SEM of 5 mice/group. Results of two-way ANOVA are given above figures. Post hoc analyses of significant main and interaction effects are described in the text. *indicates a significant effect at p < 0.05.
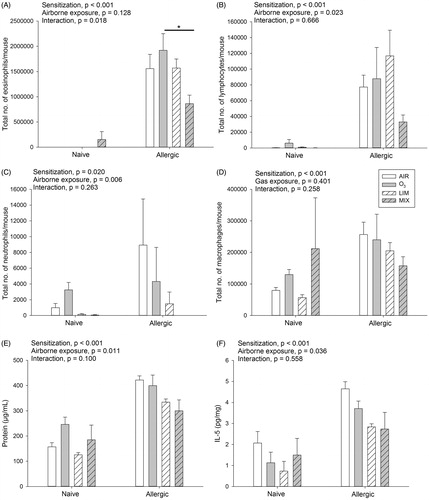
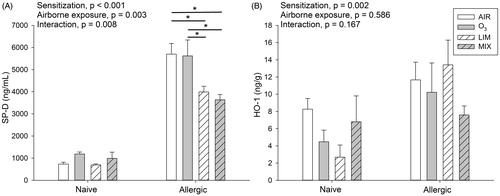
Figure 4. Naïve and allergic mice were exposed to AIR, O3, LIM and MIX for 60 min on Days 27–29. Levels of (A) SP-D in BALF and (B) HO-1 in lung homogenate were measured on Day 30. Bars represent mean ± SEM of 5 mice/group. Results of two-way ANOVA are given above figures. Post hoc analyses of significant interaction effect in (A) is shown in figure by a * indicating a significant difference at p < 0.05.