Figures & data
Table 1. Groupings and treatments of broiler chicks.
Figure 1. Effects of exposures on feeding and body mass of broiler chicks. (A) Feed intake (in terms of g/day). (B) Body weight (g) of test birds. Group 1 (G1): Control. Group 2 (G2): NDV-vaccine alone. Group 3 (G3): Arsenic-treated and non-vaccinated. Group 4 (G4): Arsenic-treated and NDV-vaccinated. All chicks in Groups 2 and 4 were challenged by field-isolated ND virus when they reached Day 24 of age. Values shown are means (±SD) in grams; N = 3/group. *Value significantly different from control on specific day (p < 0.05).
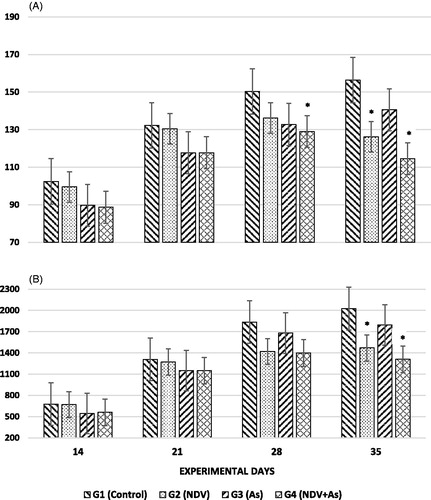
Figure 2. Absolute lymphoid organ weights (g). Values were obtained from organs harvested from birds treated as outlined in Figure 1 legend. (A) Spleen, (B) Bursa, and (C) Thymus. Values shown are means (±SD) of organ weights in grams; N = 3/group. *Value significantly different from control on specific day (p < 0.05).
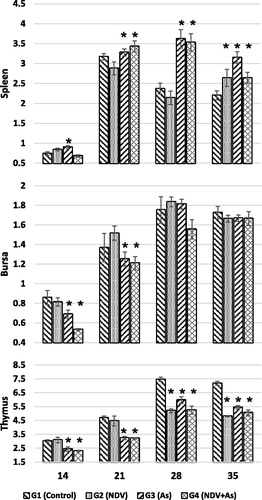
Figure 3. Relative lymphoid organ weights. Values were obtained from organs harvested from birds treated as outlined in Figure 1 legend. (A) Spleen, (B) Bursa, and (C) Thymus. Values shown are means (±SD) of organ weight:body weight ratios (unit-less); N = 3/group. *Value significantly different from control on specific day (p < 0.05).
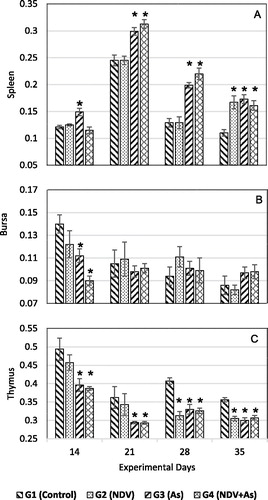
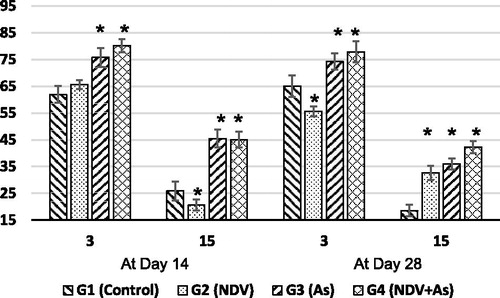
Figure 4. Antibody titers. (A) Antibody responses against Newcastle disease. (B) Antibody titers against sheep red blood cells. Birds were treated as outlined in Figure 1 legend and then bled on different experimental days. Separate sets of birds were inoculated with SRBC (see Methods) and then bled on indicated days of the experiment. Values shown are mean (±SD) inverse log2 titers. N = 3/group for values against NDV; N = 3/group for values against SRBC. *Value significantly different from control (in given ND or SRBC study) on specific day (p < 0.05).
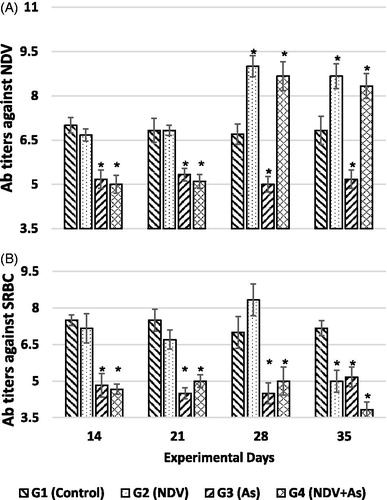
Figure 5. Cutaneous sensitivity responses. Responses on different experimental days in birds treated as outlined in Figure 1 legend. Values shown are mean changes (±SD) in mm; N = 3/group. *Value significantly different from control on specific day (p < 0.05).
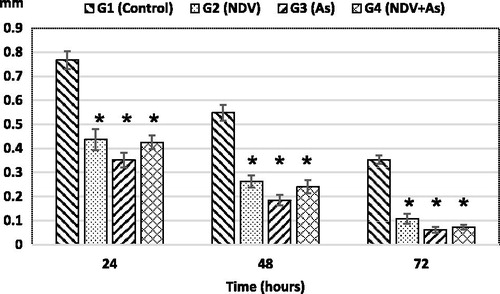
Figure 6. In vivo phagocytic potential. Phagocytic index (PI%) was evaluated in vivo on different experimental days in birds treated as outlined in Figure 1 legend. Bars shown are mean (±SD) PI% values; N = 3/group each at Days 14 and 28. *Value significantly different from control on specific day (p < 0.05).