
Figures & data
Figure 1. MAGPIX analysis of effects at 24 h post-exposure to TBT on the presence in serum of cytokine: IL-2, IL-5, IL-7, TNFα, IFNγ, IL-1β, 1 L-12βp40, IL-13, IL-15, KC, MIP-1β, MIP-2 and RANTES. BALB/C mice were exposed to: (a) PBS (control), 100 or 200 nM TBT (Experiment 1); (b) PBS, 25, 100 or 200 nM TBT (Experiment 2); (c) PBS, 25, 100 or 200 nM TBT (Experiment 3); or (d) PBS, 25, 100 or 200 nM TBT (Experiment 4). Values shown are means ± SD (n = 2 mice/group). *Significant change versus control, p <.05.
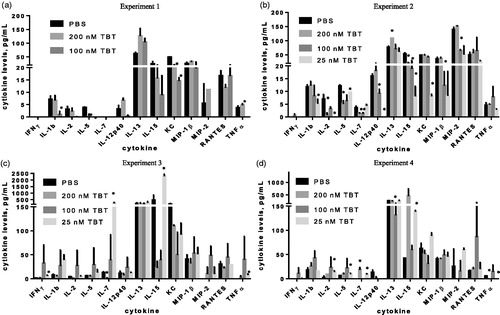
Figure 3. Time-course of changes in chemotactic cytokines in mouse serum. Effects of 6, 12, 24 and 48 h post-exposure to TBT on (a) MIP-1β, (b) MIP-2 and (c) RANTES in mouse serum. Results from three separate experiments. Primary antibodies for each of these cytokines were specific to the particular mouse cytokine and did not cross react with other mouse cytokines.
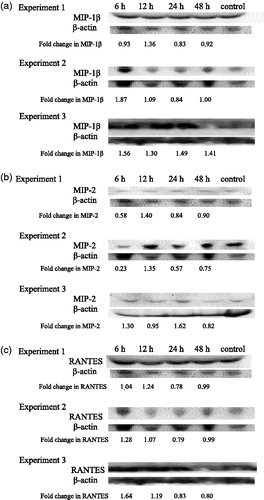
Figure 4. Time-course of changes in anti-inflammatory IL-13 in mouse serum. Results from three separate experiments. The primary antibody for IL-13 was specific to mouse IL-13 and did not cross react with other mouse cytokines.
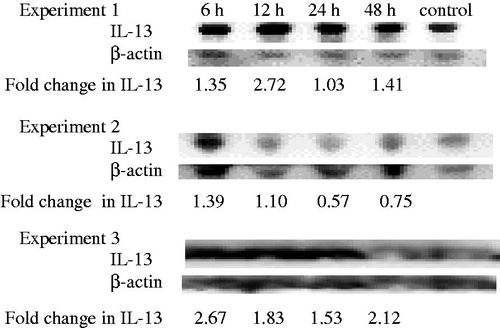
Figure 5. Effects at 24 and 48 exposure to TBT on (a) TNFα, (b) IFNγ and (c) IL-1β production by human monocyte-depleted PBMC (MD-PBMC) from an individual healthy donor. Values shown are means ± SD. *Indicates significant change in secretion compared to control [p <.05]. Data taken from (a) Hurt et al. (Citation2013) (b) Lawrence et al. (Citation2015) and (c) Brown and Whalen (Citation2015).
![Figure 5. Effects at 24 and 48 exposure to TBT on (a) TNFα, (b) IFNγ and (c) IL-1β production by human monocyte-depleted PBMC (MD-PBMC) from an individual healthy donor. Values shown are means ± SD. *Indicates significant change in secretion compared to control [p <.05]. Data taken from (a) Hurt et al. (Citation2013) (b) Lawrence et al. (Citation2015) and (c) Brown and Whalen (Citation2015).](/cms/asset/e2da4a27-afce-4f03-93bf-85127ad0e58f/iimt_a_1221867_f0005_b.jpg)