Figures & data
Table 1. Oligonucleotide primers used for quantitative real-time RT-PCR (Thummabancha et al. Citation2016).
Figure 1. Relative expression ratios of MT gene in Nile tilapia. (a) Liver. (b) spleen. (c) anterior kidney. Values shown are means ± SD. At each given timepoint, bars with different lettering significantly differ from one another at p < 0.05. N = 3 fish/group/timepoint.
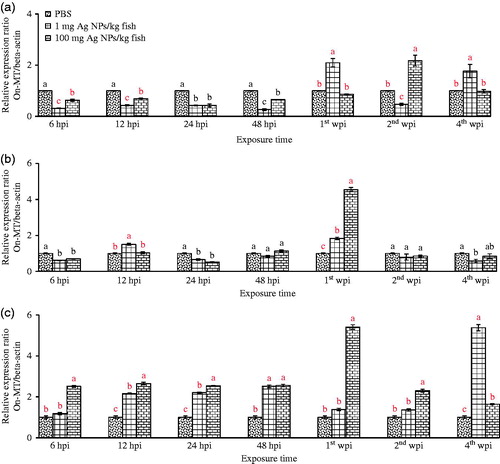
Table 2. Hematocrit levels in fish.
Table 3. Red blood cell counts in fish.
Table 4. Total white blood cell levels in fish
Figure 2. Functionality of isolated phagocytes. (a) Phagocytic activity (PA). (b) Phagocytic index (PI). (c) Phagocytic efficiency (PE). Cells (from all peripheral blood leukocytes) were isolated from tilapia exposed to 1 or 100 mg AgNP/kg at 1st, 2nd, 4th, 6th and 8th wpi. Values shown are means ± SD. At each given timepoint, bars with different lettering significantly differ from one another at p < 0.05. N = 3 fish/group/timepoint.
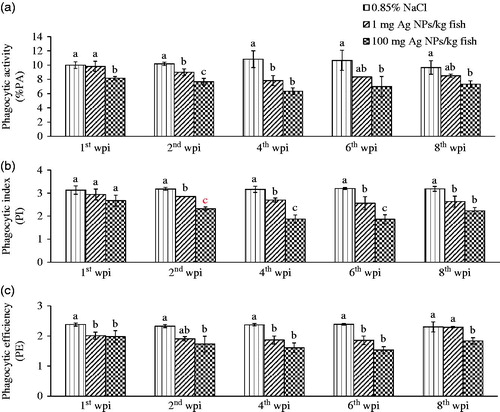
Figure 3. Antibody titer levels in tilapia immunized with vaccine (FASA) and exposed to various doses of AgNP. Values shown are means ± SD. At each given timepoint, bars with different lettering significantly differ from one another at p < 0.05. N = 3 fish/group/timepoint.
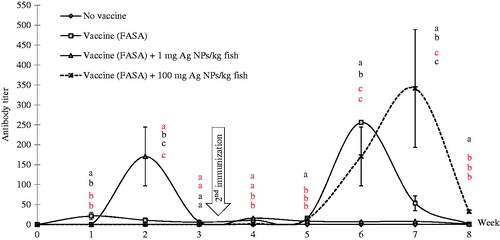
Figure 4. Cumulative mortality (%) in tilapia with/without AgNP exposure and then challenged with S. agalactiae. Fish that not exposed to AgNP served as control for infections. Values shown are means ± SD. At given timepoint, bars with different lettering significantly differ from one another at p < 0.05. N = 3 fish/group/timepoint.
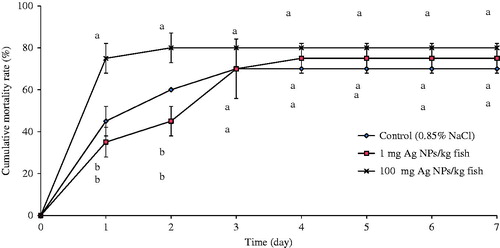
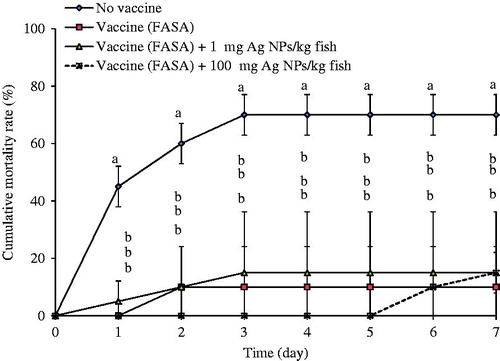
Figure 5. Cumulative mortality (%) in FASA-vaccinated tilapia with and without AgNP exposure and then challenged with S. agalactiae. Fish that were not immunized with FASA or then exposed to AgNP served as control for infections. Values shown are means ± SD. At each given timepoint, bars with different lettering significantly differ from one another at p < 0.05. N = 3 fish/group/timepoint.