
Figures & data
Figure 1. (A) Titration results of c-Met-specific phages after bio-panning of the Tomlinson library. (B) Polyclonal phage and (C) Monoclonal Phage ELISA of selected scFvs against c-MET peptides. From 56 clones, 26 presented with positive reactivity to c-Met peptide. Data shown are means [± SD] of OD values from duplicate experiments. An arbitrary cutoff 2.5 times greater than the negative control was considered positive. Positive control: anti BSA scFv, negative control: BSA.
![Figure 1. (A) Titration results of c-Met-specific phages after bio-panning of the Tomlinson library. (B) Polyclonal phage and (C) Monoclonal Phage ELISA of selected scFvs against c-MET peptides. From 56 clones, 26 presented with positive reactivity to c-Met peptide. Data shown are means [± SD] of OD values from duplicate experiments. An arbitrary cutoff 2.5 times greater than the negative control was considered positive. Positive control: anti BSA scFv, negative control: BSA.](/cms/asset/5586c12e-5590-4c27-b2fc-a450b1edeae7/iimt_a_1251512_f0001_b.jpg)
Figure 2. Production of soluble scFv. Binding of soluble scFv to c-Met and BSA wells was assessed by ELISA. Data are presented as means [± SD] of OD values from duplicate experiments. An arbitrary cutoff 2.5 times greater than the negative control was considered positive. Positive control: anti BSA scFv, negative control: BSA.
![Figure 2. Production of soluble scFv. Binding of soluble scFv to c-Met and BSA wells was assessed by ELISA. Data are presented as means [± SD] of OD values from duplicate experiments. An arbitrary cutoff 2.5 times greater than the negative control was considered positive. Positive control: anti BSA scFv, negative control: BSA.](/cms/asset/657baba7-439a-4014-9e4a-2e1b7ac192c2/iimt_a_1251512_f0002_b.jpg)
Figure 3. (A) Amplification of scFv fragments by PCR (VH and Vκ insert, ≈ 935 bp). Lane M: 100 bp +3K DNA ladder. Lanes 1–9: amplified scFv gene in 9 clones. (B) Mva-I DNA finger-printing of scFv clones, scFv genes were amplified by PCR then digested with Mva-I (BstNI) and separated over an agarose gel. Lane M: 100 bp +3K DNA ladder. Lanes 1–9: single clones digested by Mva-I. Two common patterns were seen in lanes 1, 3, and 7, and in lanes 2, 4, 8 and 9. (C) Western blot analysis of expressed scFv. Lane 1, 2, and 3: expressed products of ES1-scFv, ES2-scFv, and ES3-scFv, respectively. Lane 4: total lysate from non-induced E. coli Rosetta-Gami 2. A representative blot is shown.
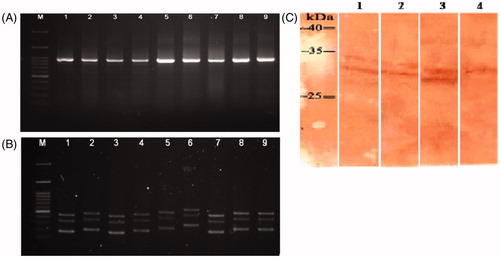
Table 1. VDJ genes and CDR3 sequences of anti c-Met scFv.
Table 2. Specificity of soluble scFv.
Figure 4. Functional inhibition assay. (A) Proliferation of HCT-116 cells in presence of HGF (100 ng/ml) (p = 0.05 vs. untreated cells). (B) Proliferation inhibited by ES1, ES2 and ES3 (77%, 72%, and 66%, respectively. (p = 0.001, p = 0.003, p = 0.002, respectively, vs. effect from an unrelated scFv). Data shown are means ± SD of OD of three independent experiments.
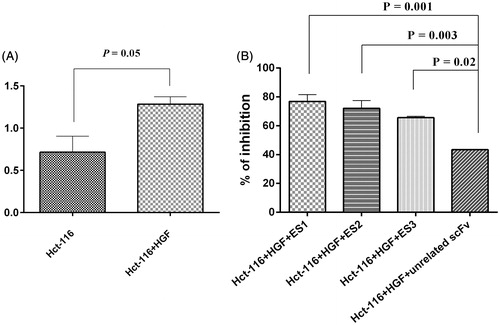
Figure 5. Annexin V/PI apoptosis assay in HCT-116 cells treated with anti-c-Met scFv. Apop-totic death was analyzed in cells treated for 24 h with unrelated scFv (negative control), HGF, ES1, ES2, or ES3. Apoptotic cell death was characterized by Annexin V+/PI- and Annexin V+/PI+ staining status using FACS. (A) Untreated cells. Cells treated with (B) unrelated scFv, (C) ES1scFv, (D) ES2 scFv, or (E) ES3 scFv.
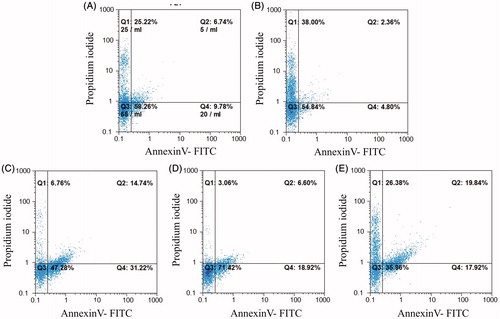
Figure 6. Annexin V/PI apoptosis assay in HCT-116 cells treated with HGF (100 ng/ml) and anti-c-Met scFv. Data shown are means [± SD] of three independent experiments.
![Figure 6. Annexin V/PI apoptosis assay in HCT-116 cells treated with HGF (100 ng/ml) and anti-c-Met scFv. Data shown are means [± SD] of three independent experiments.](/cms/asset/9cd9f115-901d-421e-b033-a01616901d4f/iimt_a_1251512_f0006_b.jpg)