Figures & data
Figure 1. Repeated topical application of triclosan induces the expression of S100A8 and S100A9 in skin tissue. (A) Protein standards (first lane) and protein lysates prepared from ear tissues (n = 4 mice) treated with 0% (acetone) control (lanes 1–4) or 3% triclosan (lanes 5–8) once daily for 10 days. (B) Western blot analysis of S100A8 and S100A9 proteins in ear tissue.
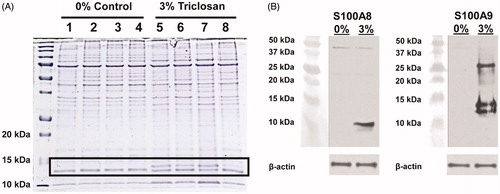
Figure 2. Expression kinetics of S100A8 and S100A9 in the skin tissue with repeated topical application of triclosan. (A) Relative fold-changes in gene expression in cDNA prepared from ear tissue of mice dosed daily with 0.75% (square) or 3% (triangle) triclosan relative to acetone control (n = 4 mice). (B) Mean fluorescence intensity of S100A8 and S100A9 protein expression in ear tissue of mice dosed daily with 0% (circle), 0.75% (square) or 3% (triangle) triclosan (n = 4–6 mice). (C) Concentrations of soluble proteins in supernatants from leukocytes extracted from ear skin tissue of mice dosed eight consecutive days with 0, 0.75, or 3.0% triclosan and cultured ex vivo for 24 h (n = 3–5 mice). ANOVA with Fisher’s LSD statistical analyses were performed; significant differences relative to 0% indicated as *p < .05, **p < .01, ***p < .001.
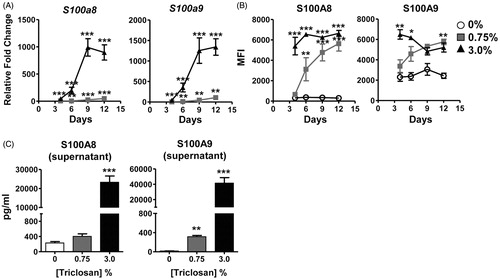
Figure 3. Changes in TLR expression in the skin and infiltrating leukocytes with repeated topical application of triclosan. (A) Relative fold changes in gene expression in cDNA prepared from ear tissue of mice dosed daily with 0.75% (square) or 3% (triangle) triclosan relative to acetone control (n = 4 mice). (B) Mean fluorescence intensity of TLR4 expression on CD45+ cells isolated from ear tissue of mice dosed eight consecutive days with 0% (white), 0.75% (gray), or 3.0% (black) triclosan (B, left) (n = 3–5 mice). Representative staining histogram of TLR4 expression on CD45+ cells isolated from ear tissue of mice dosed daily for eight consecutive days with triclosan, 0% (gray), 0.75% (dotted), 3.0% (black) and isotype staining control (gray filled) (B, right). Two-way ANOVA with Fisher’s LSD statistical analyses were performed; significant differences relative to 0% indicated as *p < .05, **p < .01, ***p < .001.
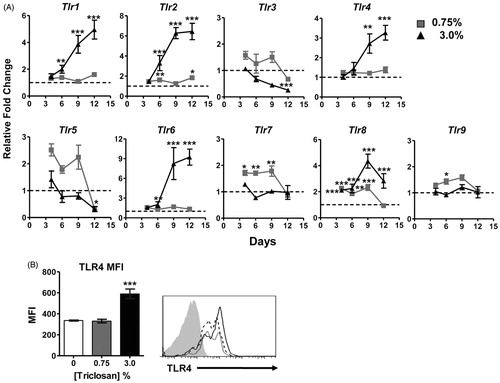
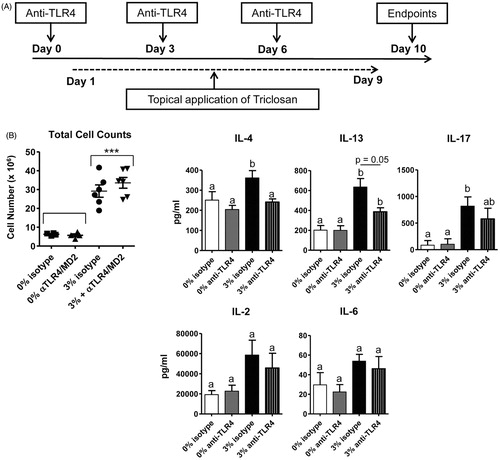
Figure 4. TLR4/MD-2 antibody blockade impairs gene expression changes in skin tissue with repeated topical application of triclosan. (A) Timeline depicting administration of antibodies and topical application of triclosan to the mice. (B) Relative fold-changes in gene expression in cDNA prepared from ear tissue on Day 5 from mice treated with 3% triclosan/isotype control antibody (gray) or 3% triclosan/anti-TLR4/MD-2 (black) relative to acetone control (white) (n = 5 mice). ANOVA with Tukey’s HSD statistical analyses were performed; significant differences indicated as *p < .05, **p < .01, ***p < .001.
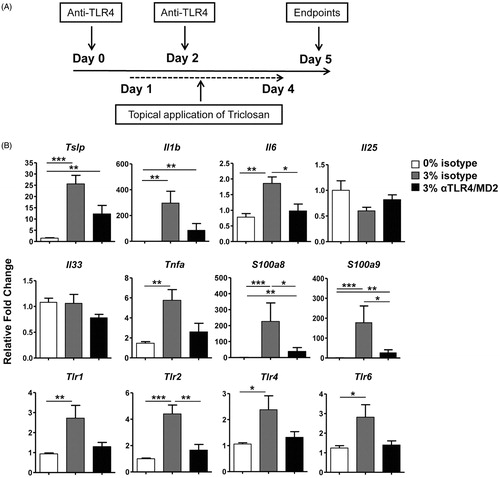
Figure 5. TLR4/MD-2 antibody blockade impairs immune responses in the local LN during repeated topical application of triclosan. Numbers of (A) viable cells and (B) leukocyte subsets collected from the LN of mice Day 5 treated with acetone/isotype (square), 3% triclosan/isotype (triangle) or 3% triclosan/anti-TLR4/MD-2 (circle) (n = 5 mice). (C) Concentrations of cytokines in supernatants from LN cells cultured 24 h ex vivo with anti-CD3/CD28. (D) Relative fold-changes in gene expression in cDNA prepared from ear tissue of mice treated with 3% triclosan/isotype control antibody (gray) or 3% triclosan/anti-TLR4/MD-2 (black) relative to acetone control (white). (E) Mean fluorescence intensity of IL-4Rα expression on LN leukocyte subsets. (F) Intracellular phosphorylated STAT6 expression in LN cells from mice treated with acetone/isotype (square), 3% triclosan/isotype (triangle) or 3% triclosan/anti-TLR4/MD-2 (circle) pulsed with IL-4 (5 ng/ml) (gray) or without (white). ANOVA with Fisher’s LSD statistical analyses were performed; significant differences indicated as *p < .05, **p < .01, ***p < .001.
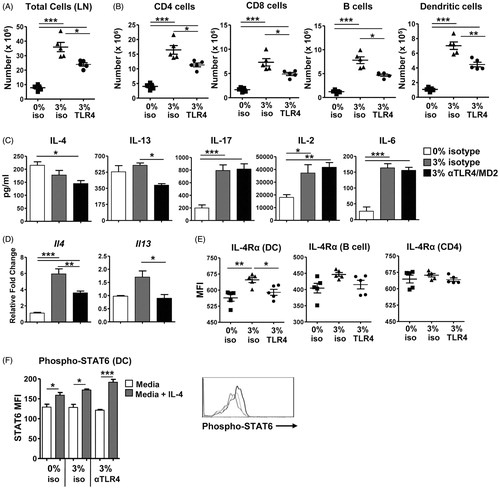
Figure 6. The effects of TLR4/MD-2 antibody blockade on the LN with extended triclosan dosing. (A) Timeline depicting administration of antibodies and topical application of triclosan to the mice. (B) Numbers of viable cells collected from the LN of mice Day 10 treated with acetone/isotype (square), acetone/anti-TLR4 (triangle), 3% triclosan/isotype (circle) or 3% triclosan/anti-TLR4 (inverted triangle) (n = 4–6 mice). (C) Concentrations of cytokines in supernatants from LN cells cultured ex vivo for 24 h with anti-CD3/CD28. Two-way ANOVA with Fisher’s LSD post-hoc statistical analyses were performed; significant differences are indicated as a ≠ b where p < .05 and ***p < .001.