Figures & data
Table 1. Chemical composition of bentonite clay (BN).
Table 2. Treatment regimens.
Figure 1. (A–D) Antibodies titers against SRBC in broiler chicks given different dietary levels of AFB1 and bentonite clay. Values shown are mean [± SD] titers (log3 of reciprocal of highest dilution giving visible agglutination, n = 6/group) Value significantly different from control at *p < 0.05, or **p < 0.01. Abbreviations: A1 = 0.1 mg AFB1/kg feed, A2 = 0.2 mg AFB1/kg feed A3 = 0.6 mg AFB1/kg feed, B1 = 3.7 g bentonite clay/kg feed, B2 = 7.5 g bentonite clay/kg feed. Bars (left to right, each set): control, A1, A2, A3, B1, B2, A1B1, A2B1, A3B1, A1B2, A2B2, A3B2.
![Figure 1. (A–D) Antibodies titers against SRBC in broiler chicks given different dietary levels of AFB1 and bentonite clay. Values shown are mean [± SD] titers (log3 of reciprocal of highest dilution giving visible agglutination, n = 6/group) Value significantly different from control at *p < 0.05, or **p < 0.01. Abbreviations: A1 = 0.1 mg AFB1/kg feed, A2 = 0.2 mg AFB1/kg feed A3 = 0.6 mg AFB1/kg feed, B1 = 3.7 g bentonite clay/kg feed, B2 = 7.5 g bentonite clay/kg feed. Bars (left to right, each set): control, A1, A2, A3, B1, B2, A1B1, A2B1, A3B1, A1B2, A2B2, A3B2.](/cms/asset/e30d812d-afd1-4435-8482-0000471b0490/iimt_a_1264503_f0001_b.jpg)
Figure 2. (A, B). In-vivo phagocytic potential, of broiler chicks fed different dietary levels of AFB1 and/or bentonite clay. Bars (left to right, each set): control, A1, A2, A3, B1, B2, A1B1, A2B1, A3B1, A1B2, A2B2, A3B2. Values shown are means ± SD (n = 6 chicks/group). Value significantly different from control at *p < 0.05, **p < 0.01, or ***p < 0.001. Abbreviations are as reported in .
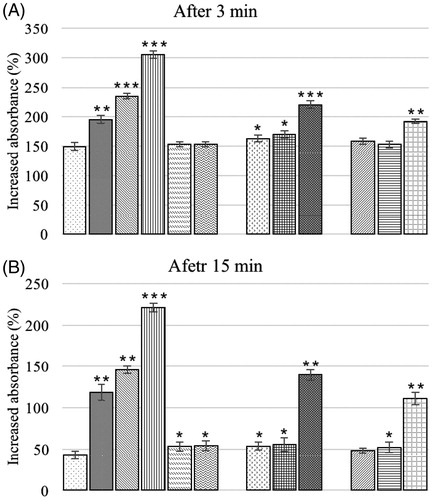
Figure 3. (A–C) Lymphoproliferative response to PHA-P of chicks fed different dietary levels of AFB1 and/or bentonite clay. Bars (left to right, each set): control, A1, A2, A3, B1, B2, A1B1, A2B1, A3B1, A1B2, A2B2, A3B2. Values shown are means ± SD (n = 6 chicks/group). Value significantly different from control at *p < 0.05 or **p < 0.01. Abbreviations are as reported in .
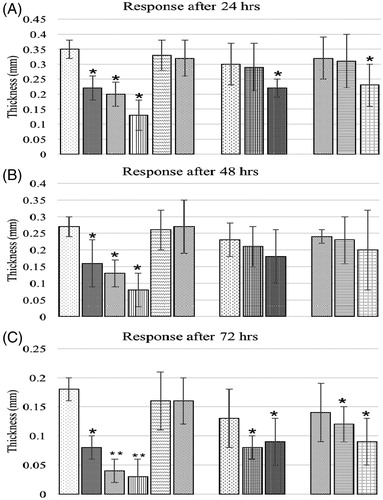
Figure 4. Follicular diameter of bursa of Fabricius of chicks fed different dietary levels of AFB1 and/or bentonite clay. Values shown are means ± SD (n = 6 chicks/group). Value significantly different from control at *p < 0.05 or **p < 0.01. Abbreviations are as reported in .
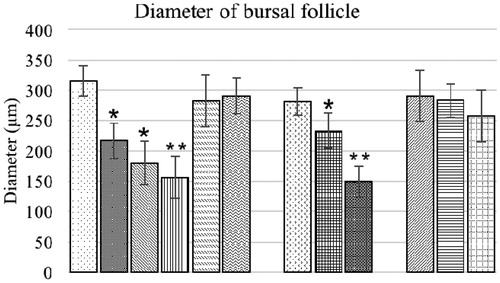
Figure 5. Intermolecular connective tissue of bursa of Fabricius of chicks fed different dietary levels of AFB1 and/or bentonite clay. Values shown are means ± SD (n = 6 chicks/group). Value significantly different from control at *p < 0.05 or **p < 0.01. Abbreviations are as reported in .
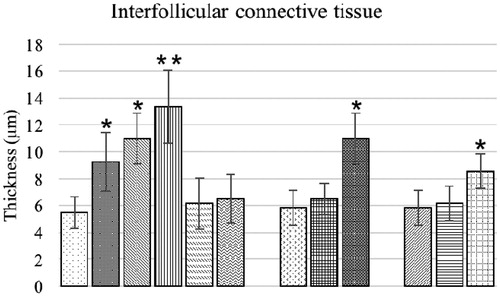
Figure 6. (A–C) Antibody titers against SRBC in broiler chicks given different dietary levels of OTA and bentonite clay. Values shown are mean [± SD titers] (log3 of reciprocal of highest dilution giving visible agglutination, n = 6/group) Value significantly different from control at *p < 0.05, or **p < 0.01. Abbreviations: O1 = 0.15 mg OTA/kg feed, O2 = 0.3 mg OTA/kg feed, O3 = 1.0 mg OTA/kg feed, B1 = 3.7 g bentonite clay/kg, B2 = 7.5 g bentonite clay/kg feed, B3 = 15 g bentonite clay/kg feed. Bars (left to right, each set): control, O1, O2, O3, B1, B2, B3, O1B1, O2B1, O3B1, O1B2, O2B2, O3B2, O1B3, O2B3, O3B3.
![Figure 6. (A–C) Antibody titers against SRBC in broiler chicks given different dietary levels of OTA and bentonite clay. Values shown are mean [± SD titers] (log3 of reciprocal of highest dilution giving visible agglutination, n = 6/group) Value significantly different from control at *p < 0.05, or **p < 0.01. Abbreviations: O1 = 0.15 mg OTA/kg feed, O2 = 0.3 mg OTA/kg feed, O3 = 1.0 mg OTA/kg feed, B1 = 3.7 g bentonite clay/kg, B2 = 7.5 g bentonite clay/kg feed, B3 = 15 g bentonite clay/kg feed. Bars (left to right, each set): control, O1, O2, O3, B1, B2, B3, O1B1, O2B1, O3B1, O1B2, O2B2, O3B2, O1B3, O2B3, O3B3.](/cms/asset/4c9da057-b05e-4e6d-9c87-1b9fd00edb1a/iimt_a_1264503_f0006_b.jpg)
Figure 7. (A, B) In vivo phagocytic potential of chicks fed different dietary levels of OTA and/or bentonite clay. Bars (left to right, each set): control, O1, O2, O3, B1, B2, B3, O1B1, O2B1, O3B1, O1B2, O2B2, O3B2, O1B3, O2B3, O3B3. Abbreviations are as reported in . Values shown are means ± SD (n = 6 chicks/group). Value significantly different from control at *p < 0.05, **p < 0.01, or ***p < 0.001.
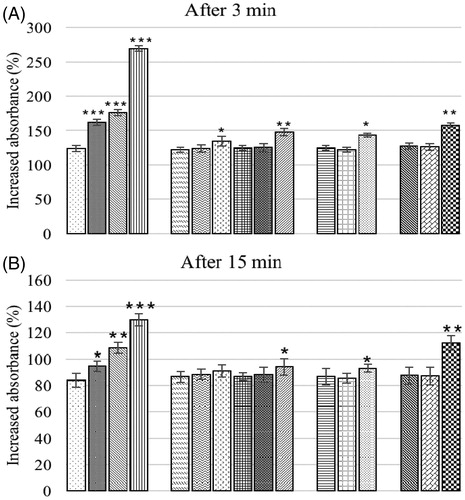
Figure 8. (A–C) Lymphoproliferative response to PHA-P of chicks fed different dietary levels of OTA and/or bentonite clay. Bars (left to right, each set): control, O1, O2, O3, B1, B2, B3, O1B1, O2B1, O3B1, O1B2, O2B2, O3B2, O1B3, O2B3, O3B3. Abbreviations are as reported in . Values shown are means ± SD (n = 6 chicks/group). Value significantly different from control at *p < 0.05.
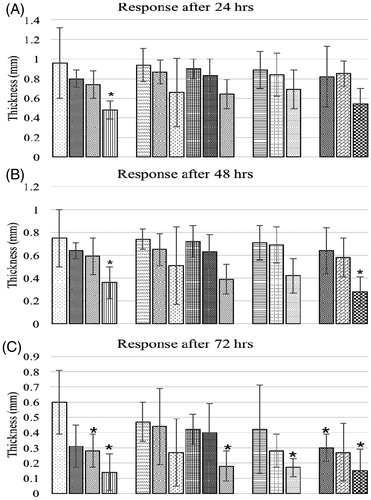
Figure 9. Follicular diameter of bursa of Fabricius of broiler chicks fed different dietary levels of OTA and/or bentonite clay. Values shown are means ± SD (n = 6 chicks/group). Value signifi-cantly different from control at *p < 0.05 or **p < 0.01. Abbreviations are as reported in .
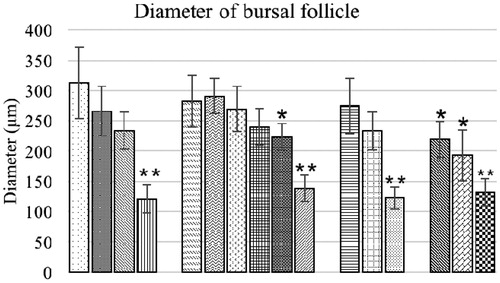
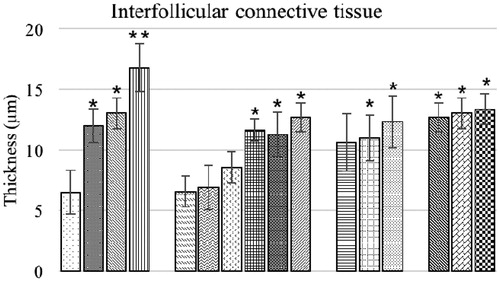
Figure 10. Inter-follicular connective tissue (μm) of bursa of Fabricius of chicks fed different dietary levels of OTA and/or bentonite clay. Values shown are means ± SD (n = 6 chicks/group). Value significantly different from control at *p < 0.05 or **p < 0.01. Abbreviations are as reported in .