
Figures & data
Table 1. Characteristics of children who contributed serum antibody concentrations at the two follow-up examinations in Cohort 5.
Table 2. Change (in percent) of the pre-booster serum-antibody concentrations at age 5 years associated with a doubling of the serum concentration of major PFASs at three different times of examination.
Figure 1. Serum concentrations of (a) PFOA and (b) PFOS at age 18 months, as calculated from neonatal concentration and the duration of breastfeeding (vertical scale) and compared to the measured concentration (horizontal scale).
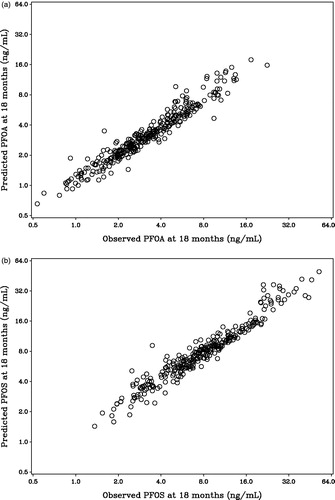
Table 3. Percentage change in serum-PFAS concentrations per month during exclusive breastfeeding, partial, and none.
Table 4. Effect of doubling in predicted serum concentration of PFOA and PFOA at different ages (in months) with adjustment for differences in dependence on breastfeeding in the two cohorts.