
Figures & data
Figure 1. Experimental design.
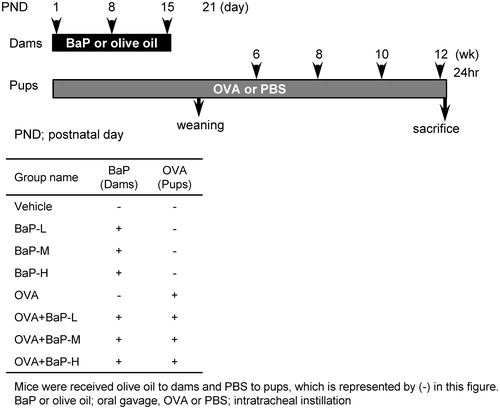
Table 1. Number of inflammatory cells in bronchoalveolar lavage (BAL) fluid and pulmonary histopathological findings in male offspring.
Table 2. Number of inflammatory cells in the bronchoalveolar lavage (BAL) fluid and pulmonary histopathological findings in female offspring.
Table 3. Protein levels of Th1/Th2 cytokines in the lungs following exposure to BaP on allergic airway inflammation in male offspring.
Table 4. Protein levels of Th1/Th2 cytokines in the lungs following exposure to BaP on allergic airway inflammation in female offspring.
Figure 2. Ovalbumin (OVA)-specific Ig antibody levels in serum following lactational expo-sure to benzo[a]pyrene in allergic airway inflammation in offspring. Serum OVA-specific IgE and IgG1 levels were assessed 24 h after the respective final OVA instillation. Data shown are means ± SE for 4–8 animals/group. **p < 0.01 vs. vehicle group.
![Figure 2. Ovalbumin (OVA)-specific Ig antibody levels in serum following lactational expo-sure to benzo[a]pyrene in allergic airway inflammation in offspring. Serum OVA-specific IgE and IgG1 levels were assessed 24 h after the respective final OVA instillation. Data shown are means ± SE for 4–8 animals/group. **p < 0.01 vs. vehicle group.](/cms/asset/600120ae-134a-4086-b553-c6f4bfb6ccd0/iimt_a_1442379_f0002_b.jpg)
Figure 3. Total cell number and cell surface molecule expression in mediastinal lymph node cells: male offspring. Data is from FACS sorting of cells harvested 24 h after final intratracheal instillation. (A) Total cell number. (B–D) ovalbumin (OVA)− groups. (E–G) OVA+ groups. (B,E) CD11c+PDCA-1+ and CD11c+PDCA-1− cells. (C,F) CD28+, TCRβ+, and CD28+TCRβ+ cells. (D,G) CD86+, MHC Class II+, and MHC Class II+CD86+ cells. Data shown are means ± SEM of 4–8 animals for total cell number or 4 or 5 animals for FACS analysis, respectively. **p < 0.01 vs. vehicle group, #p < 0.05 vs. OVA group.
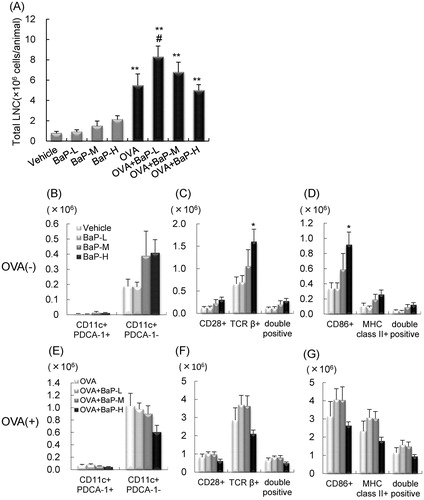
Figure 4. Total cell number and cell surface molecule expression in mediastinal lymph node cells: female offspring. Data is from FACS sorting of cells harvested 24 h after final intratracheal instillation. (A) Total cell number. (B–D) ovalbumin (OVA)(−) groups. (E–G) OVA(+) groups. (B,E) CD11c+PDCA-1+ and CD11c+PDCA-1− cells. (C,F) CD28+, TCRβ+, and CD28+TCRβ+ cells. (D,G) CD86+, MHC Class II+, and MHC Class II+CD86+ cells. Data shown are means ± SEM of 4–8 animals for total cell number or 4 animals for FACS analysis, respectively. *p < 0.05, **p < 0.01 vs. vehicle group, #p < 0.05 vs. OVA group.
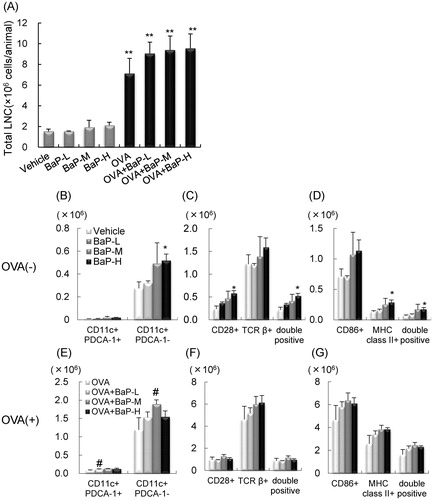
Table 5. Proliferation/Activation of mediastinal lymph node cells in male offspring.
Table 6. Proliferation/Activation of mediastinal lymph node cells in female offspring.