
Figures & data
Figure 1. Airway inflammatory cell influx and cytokine/chemokine response following repetitive LPS exposure is reduced in female mice. Male and female mice received intranasal inhalation of saline or LPS (100 ng) daily for 3 weeks and bronchoalveolar lavage fluid was collected 5 h following final exposure. Bar graphs depict mean (±SE) of (A) total cells, neutrophils, and macrophages, and (B) cytokine/chemokine levels. N = 8 mice/treatment group from two independent experiments. Significant difference (*p < 0.05, **p < 0.01, ***p < 0.001) vs. matched saline; significant differences between male and female denoted by line (#p < 0.05, ##p < 0.01).
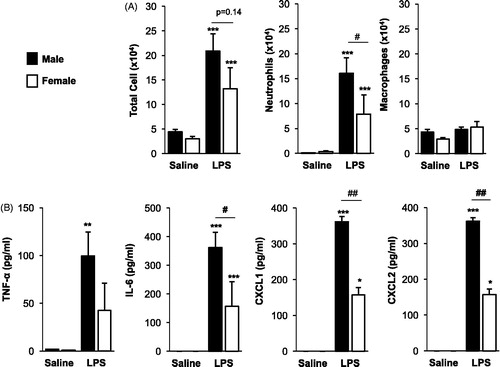
Figure 2. Repetitive LPS exposure-induced lung parenchymal cellular influx is mildly increased in male mice. Male and female mice received intranasal inhalation of saline or LPS (100 ng) daily for 3 weeks and whole lung sections (4–5 μm) were stained with hematoxylin and eosin. (A) Representative lung section from each treatment group is shown at 10× magnification. Arrows indicate inflammatory cell infiltrates. (B) Bar graph depicts means (±SE) of semi-quantitative degree and distribution of alveolar and bronchiolar compartment inflammation. Line scale is 100 μm. N = 8 mice/treatment group from two independent experiments. Significant difference (*p < 0.05, **p < 0.01, ***p < 0.001) vs. matched saline; significant differences between male and female denoted by line (#p < 0.05).
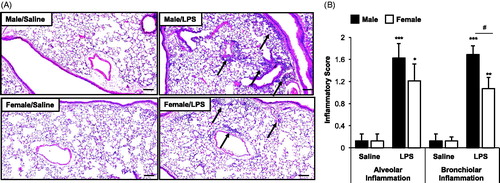
Figure 3. Male, but not female, mice were susceptible to the systemic bone deterioration response following repetitive LPS inhalation exposure by micro-CT imaging and analysis. (A) A representative three-dimensional (3D) reconstructed image from region of interest of proximal tibia from one mouse per treatment group (eight mice/group for two independent studies). (B) Trabecular bone of proximal tibia was analyzed for bone parameters by micro-CT analysis. Bar graphs depict means (± SE) of these bone parameters from eight mice/treatment group from two independent studies. Note that saline-treated (control) female animals have significant differences (##p < 0.01, ###p < 0.001) compared to male control mice. Statistical difference in LPS-induced changes (*p < 0.05, **p < 0.01, ***p < 0.001) only demonstrated in male mice as compared to saline.
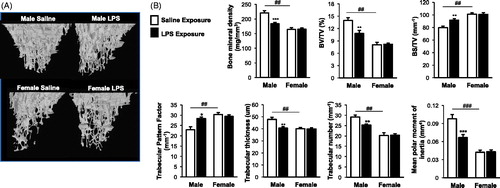
Figure 4. Repetitive inhalant LPS exposures increase osteoclast precursor populations with no sex differences demonstrated. Female and male mice were in treated with saline or LPS (100 ng) daily for 3 weeks, then euthanized and bone marrow cells were collected and analyzed by flow cytometry. After exclusion of debris and dead cells, triple negative (TN) cells were gated based upon CD45R-CD3-CD11blo phenotype. TN cells were gated based on CD115, CD117, and CD27 expression. Osteoclast precursor (OCP) populations defined as frequency of TN cells expressing CD115 and CD117 and TN cells expression CD115, CD117, and CD27. (A) A representative contour plot of OCPs from saline and LPS-treated animal are shown. (B) Bar graphs depict the mean percentage of OCP populations as normalized to live bone marrow cells with standard error bars. N = 6 mice/group from two independent studies. ANOVA with Mann–Whitney nonparametric test. Significant difference vs. respective saline is denoted (**p < 0.01, **p < 0.001).
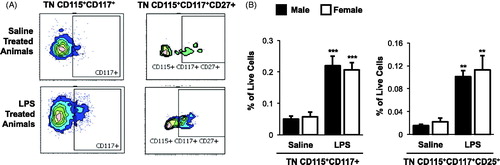
Figure 5. Systemic response of serum pentraxins 1, 2, 3 (acute phase proteins) in male and female mice treated with inhalant LPS. Bar graphs depict mean with standard error bars of serum pentraxin levels in treatment groups. Significant difference denoted by line as *p < 0.05, **p < 0.01, and ***p < 0.001. Nonsignificant p values shown when p > 0.05 between groups. N = 8 mice/group from two independent studies.
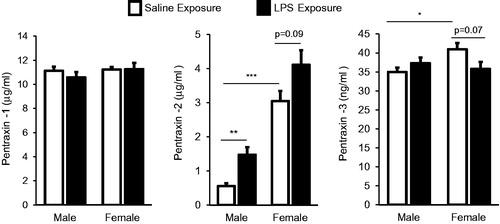
Table 1. A role for female sex hormone in modulating inhalant LPS-induced bone deterioration.
Data availability statement
Data that support the findings of this study are available from the corresponding author upon reasonable request.