Figures & data
Figure 1. Ear ILC2 Phenotyping following TDI sensitization in mice. Flow cytometric analysis of ILC2 isolated from the ear at 2 days post dermal treatment (25 µl/ear) of female Balb/c mice with acetone, 0.5% TDI, or 4% TDI (as indicated on the X-axis). These concentrations were previously determined to be sensitizing following a single dermal application. While exposure at 4% induced irritation, 0.5% induced sensitization in the absence of irritation. Cells were isolated from the ear via enzymatic digestion (Liberase-TL) and then passed through cell strainer to obtain single cell suspensions. Cells were counted, stained, fixed, and data acquired on an LSRII flow cytometer (BD Biosciences). Following doublet-exclusion gating, ILC2s were identified as Lineage-CD45+CD90+CD25+CD127+ cells. The lineage gate was composed of antibodies detecting the following antigens: Ter119, CD19, CD3e, CD11b, Ly-6G, CD2, and CD11c. ILC2s were then further characterized by analyzing median fluorescent intensities (MFI) for activation markers (A) ICOS, (B) KLRG1, and (C) CD25. Bars represent mean MFI ± SEM. n = 5 mice/treatment group. p Values are represented by asterisks (p < .01).
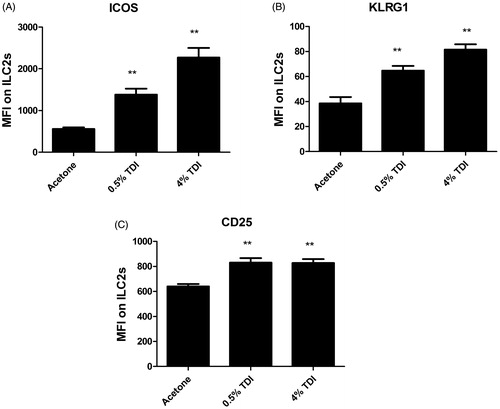
Figure 2. Treg Phenotyping in mouse skin following TDI sensitization. Flow cytometric analysis of dermal Treg cells following treatment (25 µl/ear) of female Balb/c mice with acetone, 0.5% TDI, or 4% TDI (as indicated on X-axis). These concentrations were previously determined to be sensitizing following a single dermal application. While exposure at 4% induced irritation, 0.5% induced sensitization in the absence of irritation. Cells were isolated from the ear via enzymatic digestion (Liberase-TL) and then passed through a cell strainer to obtain single cell suspensions. Cells were counted, stained, fixed, and data was acquired on an LSRII flow cytometer (BD Biosciences). Following doublet exclusion gating, Treg cells were first gated on their expression of CD45, CD3, and CD4 then were further identified by CD25 and Foxp3 expression (defined as Treg cells) at indicated timepoints. Treg cell frequency and number were determined based on flow cytometry analysis and extrapolation of this data with total ear cellularity. Graph symbols represent mean (±SE) of 5 mice/group. p Values are presented as ^0.5% TDI and *4% TDI (p < .05). Dermal treatment groups are indicated by the following symbols: circle = acetone, square = 0.5% TDI, and triangle =4% TDI.
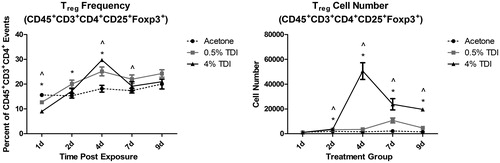
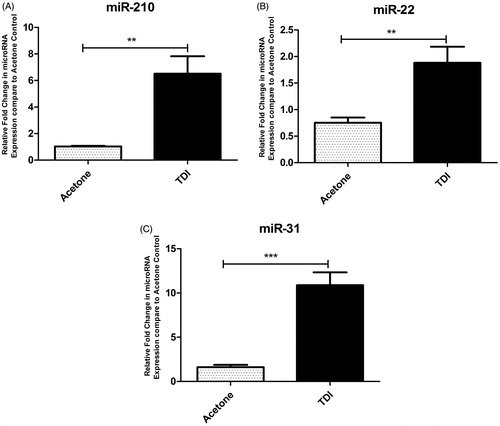
Figure 3. MiRNA expression in mouse skin following TDI sensitization. RT-PCR analysis of miRNA expression in the ears following a single dermal application (25 µl/ear) to female Balb/c mice of 4% TDI or acetone vehicle. This concentration was previously determined to be sensitizing following a single dermal application. Expression of (A) miR-210, (B) miR-22, and (C) miR-31 determined 7 days post-TDI exposure. Bars represent mean relative fold-change (±SE) of 4–5 mice/group. p Values are represented by asterisks (p < .05).