Figures & data
Figure 1. Mice treated with AQ develop delayed-onset mild liver injury that appears to be recovering despite continued treatment. Designations: Wild-type C57BL/6 mice (Control); wild-type mice treated with AQ (AQ); CCR2−/− control mice (CCR2−/−); and, CCR2−/− mice treated with AQ (CCR2−/−/AQ). Wild-type C57BL/6 mice and CCR2−/− mice treated with AQ had ALT levels significantly greater than Controls at Weeks 2–4 (significance of both AQ-treated mouse groups compared to control are displayed in figure). However, the two AQ-treated mouse groups did not significantly differ from each other. Wild-type C57BL/6 mice and CCR2−/− mice treated with AQ also had ALT levels significantly greater than CCR2−/− mice at Weeks 2–4 (p ≤ 0.05). Values shown are means ± SE. Two-way ANOVA. p < 0.05*, < 0.01**, < 0.001***, < 0.0001****.
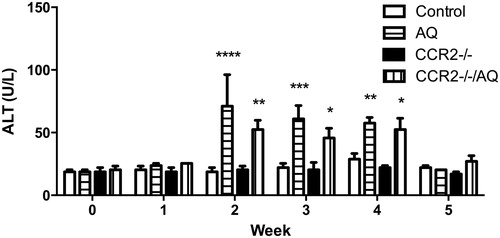
Figure 2. Stained liver sections. Samples shown are representative H&E-stained sections. (A) Control. (B) AQ. (C) CCR2−/−. (D) CCR2−/−/AQ. Group identities are defined in legend. Liver histology appeared similar between groups, with only a few necro-inflammatory foci being noted in the tissues from the AQ-treated groups.
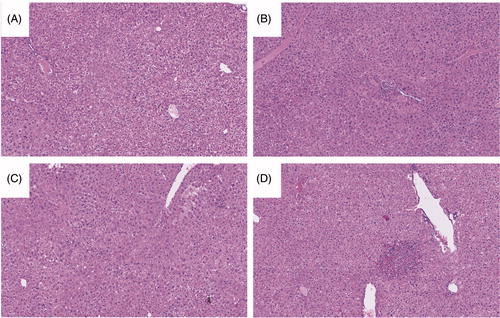
Figure 3. Flow cytometry analysis of mononuclear leukocytes in the liver. Representative zebra plot and average from three mice/group are displayed. Mononuclear cells with significant differences among the treatment groups compared to control are displayed (when the difference was not significant the data are not shown). Wild-type C57BL/6 control mice (Control), wild-type C57BL/6 mice treated with AQ (AQ), CCR2−/− control mice (CCR2−/−), CCR2−/− mice treated with AQ (CCR2−/−/AQ). (A) The percentage of CD11b+/GR-1+ macrophages in the CCR2−/− group was less compared to the AQ group. (B) Significantly decreased percentage of NK cells in the CCR2−/− group compared to AQ group. Values shown are means ± SE. One-way ANOVA. *p < 0.05.
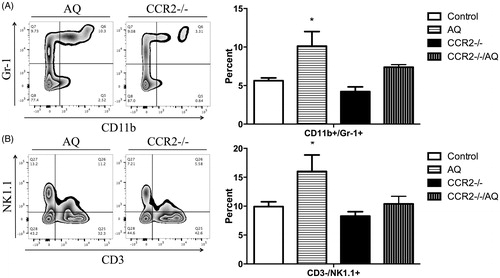
Figure 4. ALT levels. PD1−/− mice treated with anti-CTLA-4 and AQ have significantly greater ALT levels at Weeks 3–5 compared to PD1−/− mice treated with anti-CTLA-4, AQ, and anti-CCL2 (significance displayed in figure). PD1−/− mice treated with anti-CTLA-4 and AQ also had significantly greater ALT levels at Weeks 3–6 (p ≤ 0.05) compared to PD1−/− mice treated with anti-CCL2. PD1−/− mice treated with anti-CCL2 (PD1−/−/anti-CCL2), PD1−/− mice with anti-CTLA-4 and AQ (PD1−/−/anti-CTLA-4/AQ), and PD1−/− mice with anti-CTLA-4, AQ, and anti-CCL2 (PD1−/−/anti-CTLA-4/AQ/anti-CCL2). Values represent the mean ± SE. Analyzed for statistical significant by two-way ANOVA. *p < 0.05; **p < 0.01.
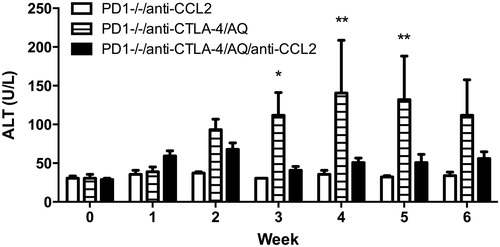
Figure 5. Stained liver sections. Samples shown are representative H&E-stained sections. (A) PD1−/−/anti-CCL2. (B) PD1−/−/anti-CTLA-4/AQ. (C) PD1−/−/anti-CTLA-4/AQ/anti-CCL2. Group identities are fully defined in Figure 4 legend. Anti-CCL2 treatment did not appear to cause significant abnormalities, while PD1−/− mice treated with anti-CTLA-4 and AQ demonstrated the characteristic numerous necro-inflammatory foci seen in previous experiments. PD1−/− mice treated with anti-CTLA-4, AQ, or anti-CCL2 still presented with a few necro-inflammatory foci in their liver; however, these were significantly fewer in prevalence than in livers of PD1−/− mice treated with anti-CTLA-4 and AQ in the absence of anti-CCL2.
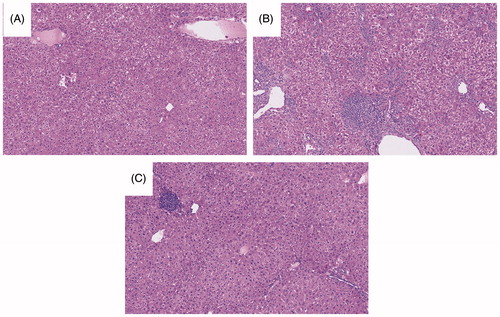
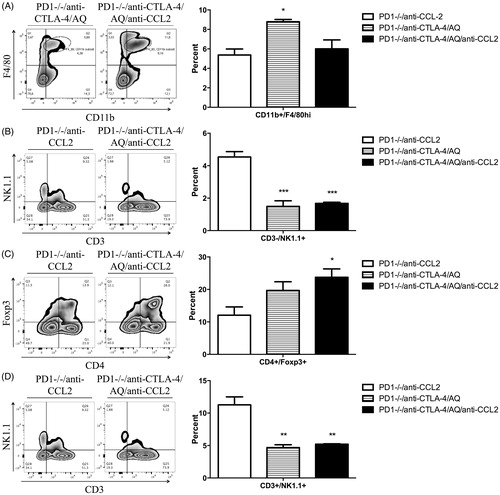
Figure 6. Flow cytometry analysis of mononuclear leukocytes in liver. Representative zebra plot and average from three animals are displayed. Mononuclear cells with significant differences among the treatment groups compared to control are displayed (data not shown when difference was not significant). PD1−/− mice treated with an anti-CCL2 (PD1−/−/anti-CCL2), PD1−/− mice with anti-CTLA-4 and AQ (PD1−/−/anti-CTLA-4/AQ), PD1−/− mice with anti-CTLA-4, AQ, and anti-CCL2 (PD1−/−/anti-CTLA-4/AQ/anti-CCL2). (A) Significantly decreased percentage of F4/80hi macrophages in the PD1−/−/anti-CTLA-4/AQ/anti-CCL2 group compared to in PD1−/−/anti-CTLA-4/AQ group. (B) Significantly decreased NK cell percentages in PD1−/−/anti-CTLA-4/AQ and PD1−/−/anti-CTLA-4/AQ/anti-CCL2 groups compared to in PD1−/−/anti-CCL2 group. (C) Treg cell percentages were significantly increased in PD1−/−/anti-CTLA-4/AQ/anti-CCL2 mice vs. in the PD1−/−/anti-CCL2 mice. (D) NKT cells were significantly decreased in PD1−/−/anti-CTLA-4/AQ and PD1−/−/anti-CTLA-4/AQ/anti-CCL2 groups compared to in PD1−/−/anti-CCL2 mice. Values shown are means ± SE. One-way ANOVA. *p < 0.05, ***p < 0.001.