Figures & data
Figure 1. Viability of BMDC incubated 12 h with AgNP. Viability analyzed by fluorescein-diacetate and ethidium bromide (FDA/Et-Br) staining. (a) Microphotograph (10X) illustrating dual-staining to discriminate metabolically-active live (green) vs. dead membrane-injured (red) cells. (b) Viability percentages. Cells with no treatment = negative controls (NT); cells treated with 40% DMSO = positive control. *p < 0.05 vs NT.
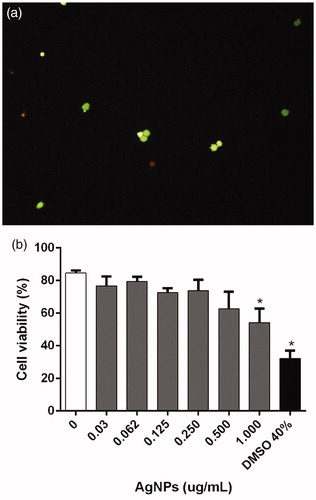
Figure 2. Assessment of levels of live BMDC after 12 h incubation with AgNP (Calcein-AM assay). (a) Representative dot-plots with percentage BMDC positive for Calcein and EthD-1. (b) BMDC live and dead percentages.
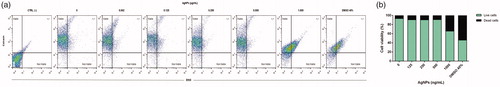
Figure 3. Cell death modality among BMDC incubated 12 h with AgNP. Percentages of live, early apoptotic, late apoptotic, and necrotic cells were assessed using FITC-Annexin V\propidium iodide (PI) staining and flow cytometry.
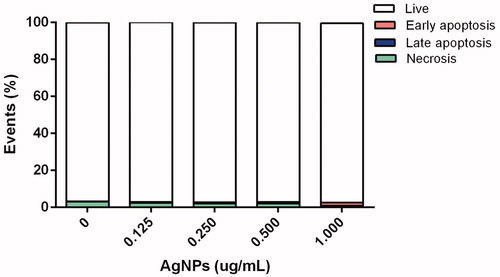
Figure 4. DNA damage induced by AgNP. (a)=DNA migration index (MgI) in arbitrary units (a.u.) use to reflect levels of strand-breaks (Comet assay) in BMDC exposed 12 h to AgNP. (b) Representative photos of comets; numbers indicate Comet scores based on nucleus ratio (r). Methyl methane sulfonate (MMS)-treated cells = positive control. *p < 0.05 vs. untreated control.
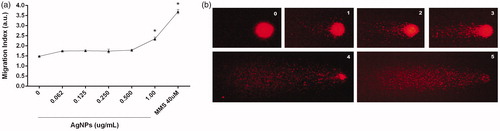
Figure 5. Representative dot-plots of differentiated BMDC among BMDC incubated 12 h with AgNP. (a) Characterization of BMDC populations by granularity (side-scatter SSC-H) and size (forward scatter FSC-H). (b) MHCII and CD11c expression among the cells (right top quadrant). Unstained (control) cells are shown for comparison.
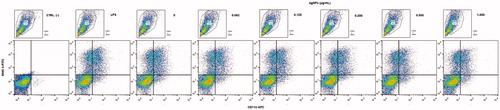
Figure 6. MHC Class II molecule expression on BMDC after 12 h exposure to AgNP. (a) Percentage MHCII+ cells. (b) Mean fluorescence intensity (MIF) for MHCII expression among MHCII+ cells. Lipopolysaccharide (LPS)-treated cells = positive control. Values shown are means ± SD (n = 3/treatment). *p < 0.05 vs. untreated cells.
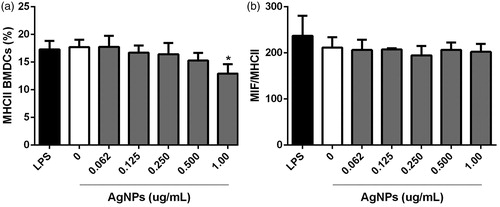
Figure 7. Co-stimulatory CD40 molecule expression on MHC11+CD11c+ BMDC after 12 h exposure to AgNP. (a) Percentage CD40+ cells. (b) MIF for CD40 expression among CD40+ cells. LPS-treated cells = positive control. Values shown are means ± SD (n = 3/treatment).
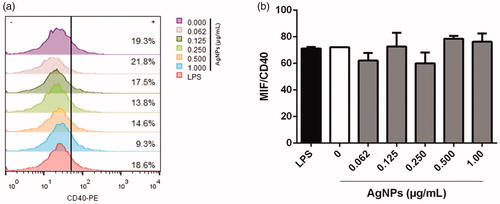
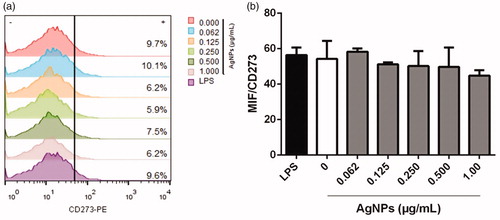
Figure 8. Co-inhibitory CD273 molecule expression on MHC11+CD11c+ BMDC after 12-h exposure to AgNP. (a) Percentage CD273+ cells. (b) MIF for CD273 expression. LPS-treated cells = positive control. Values shown are means ± SD (n = 3/treatment).