Figures & data
Figure 1. ICC staining of A431 cells and PHF normal fibroblasts. Intracellular localization of VEGFR-1 in (a) A431 and (b) PHF cells. (c) Nuclear localization of VEGFR-1 in A431 cells treated with 0.05% PBST prior to fixation. (d) Almost complete absence of nuclear VEGFR-1 in PHF cells treated with 0.05% PBST prior to fixation. Representative images are shown. 400X magnification.
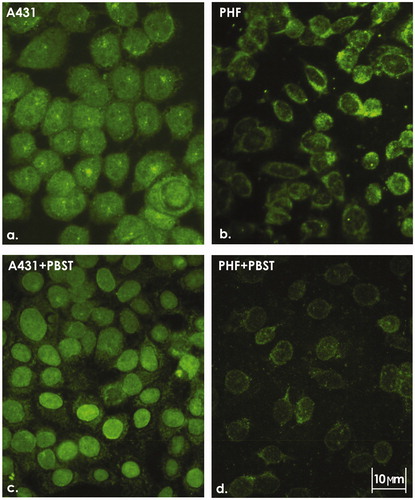
Figure 2. VEGFR-1 presence on cytoplasmic membrane of BRO and A431 tumor cell lines and PHF normal human fibroblasts. Flow cytometry using nonpermeabilized cells. Staining with anti-VEGFR-1 antibodies (dark gray) and only with control antibodies (white). Graph overlapping area is light gray. VEGFR-1 was almost absent on the cytoplasmic membrane of all three cell lines. Histogram of fluorescence intensity of nonpermeabilized human (a) BRO (ΔMFI = 14.4 ± 7.4), (b) A431 (ΔMFI = 21.4 ± 8.3), and (c) PHF (ΔMFI = 15.8 ± 7.2) cells. Representative histograms are shown.
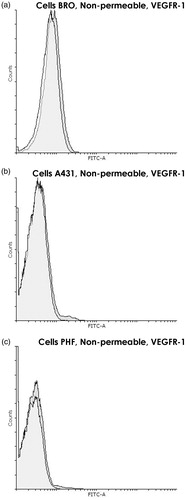
Figure 3. VEGFR-1 within BRO and A431 tumor cell lines and PHF normal human fibroblasts. Flow cytometry using permeabilized cells (90% methanol). Staining with anti-VEGFR-1 (dark gray) and only with control (white) antibodies. Graph overlapping area is light gray. Intracellular VEGFR-1 is found in all three lines; however, in PHF, its content is ≈3 times lower than in both tumor lines (p < 0.02). Histogram of fluorescence intensity of methanol-permeabilized human (a) BRO (ΔMFI = 425 ± 92), (b) A431 (ΔMFI = 302 ± 81), and (c) PHF (ΔMFI = 123 ± 40) cells. Representative histograms are shown.
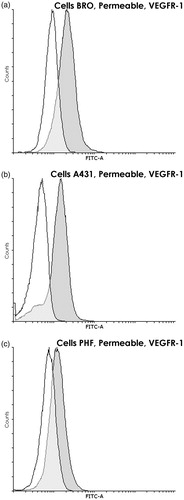
Figure 4. Nuclei of A431 cells. Integrity of nuclear membrane and absence of cytoplasmic residues confirmed by microscopic analysis after staining. (a) Mayer’s hematoxylin. (b) Romanovsky’s Azur-Eosin. Representative microphotographs are shown. 400X magnification.
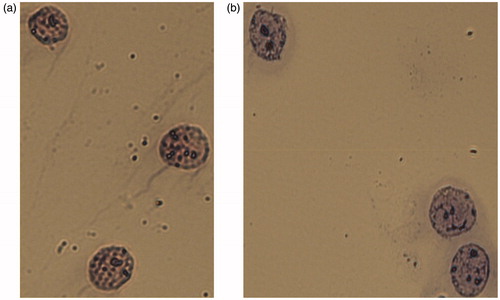
Figure 5. Selection of the gate for nuclei of A431 cells. (a) FSC/SSC DotPlot graph. Single, cytoplasm-free nuclei are highlighted in red. (b) The cell-cycle histogram (propidium iodide-staining) confirms the correctness of selected gate.
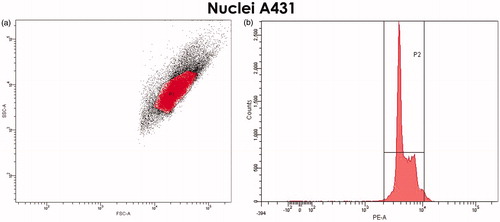
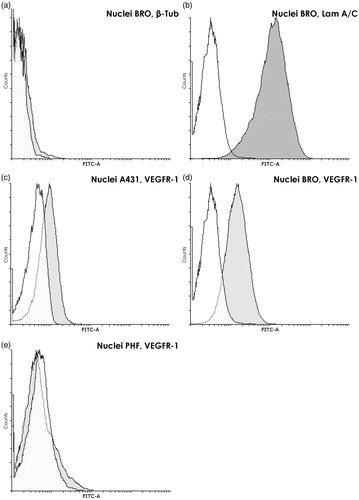
Figure 6. Analysis of proteins in nuclei of tumor and normal cells. (a) Absence of specific cytoplasmic marker β-tubulin in the nuclei of BRO tumor cells. Flow cytometry. Staining with anti-β-tubulin (dark gray) and only with control (white) antibodies. Graph overlapping area is light gray. β-Tubulin is almost absent in extracted nuclei (ΔMFI = 7.6 ± 2.6). (b) High content of nuclear marker lamin A/C in nuclei of BRO tumor cells. Flow cytometry after staining with anti-LamA/C (dark gray) and only control (white) antibodies. Graph overlapping area is light gray. An extremely high content of lamin A/C was found in extracted nuclei (ΔMFI = 4109 ± 1226). (c–e) VEGFR-1 in nuclei of BRO and A431 cell lines and PHF normal human fibroblasts. Flow cytometry. Staining with anti-VEGFR-1 (dark gray) and only control (white) antibodies. Graph overlapping area is light gray. VEGFR-1 is found in nuclei of BRO and A431 tumor cells and not in nuclei of normal fibroblasts. The highest nuclear VEGFR-1 content was found in the most malignant cell line, that is, ΔMFI for BRO was 1.75 times higher than that for A431 (p = 0.014). Representative histogram of fluorescence intensity of nuclei of human (c) A431 (ΔMFI = 171 ± 49), (d) BRO (ΔMFI = 300 ± 59), and (e) PHF (ΔMFI = 12.7 ± 6.9) cells.