
Figures & data
Figure 1. Preparation of the positive control. The positive control was used as quality control in the enzyme-linked immunosorbent assay (ELISA). Mouse serum containing mouse immunoglobulin (Ig) and inactivated complement was incubated with heat-aggregated human IgG (“Complement Activator”) to stimulate complement activation by the classical complement pathway. Monomeric mouse IgG was able to bind to aggregated human IgG, leading to formation of complement bound hIgG-mIgG complexes. ![]()
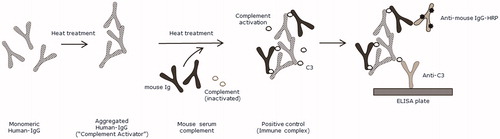
Figure 2. cCIC detected in a sandwich enzyme-linked immunosorbent assay (ELISA). Rabbit anti-C3 and goat anti-mIgG HRP were used for detection of complement C3 bound to mIgG. ![]()
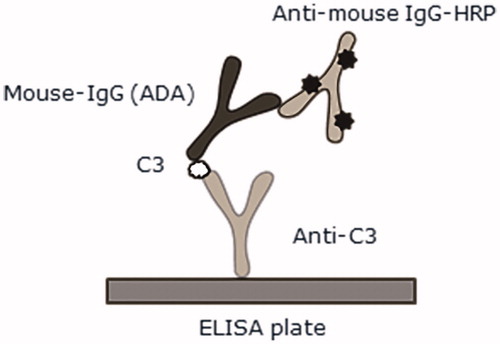
Figure 3. cCIC assay performance. (A) Four quality controls (QC) (●) and lower acceptance criteria (—) of the positive controls were calculated based on six independent assay runs. (B) Stability of undiluted positive control following storage at −80 °C for 3 months or 5 d, at 4 °C for 1 or 5 d, or after four or eight repeated freeze/thaw cycles. Samples were diluted 1:80 and analyzed (in duplicate) in cCIC assay. (C) Specificity of a mouse plasma pool previously analyzed with high cCIC levels, following separation into IgG and non-IgG fractions using protein G columns. The non-IgG fraction shows minimal signal, whereas the IgG fraction, shows larger signal, similar to the un-fractioned mouse plasma. The IgG-fraction signal was comparable to the positive control itself at dilution factor 1:40–1:160. (D,E) No considerable changes in assay readout from 1:80 plasma (D) or QC (E) containing various concentrations of BSA were observed, which suggested no interference between BSA and assay antibodies. (F) Positive cCIC results were detected in 1/12, 12/12, 7/12, and 1/12 mice dosed subcutaneously twice weekly for 13 Weeks with either vehicle, 50 mg/kg BSA, 10 mg/kg hIgG1, or 10 mg/kg hzIgG4. Dotted line represents cut-point. Signal expressed as optical density (OD) signal (A–E), signal to noise (S/N; OD signal/QCneg) (F) and mean + SD (F).
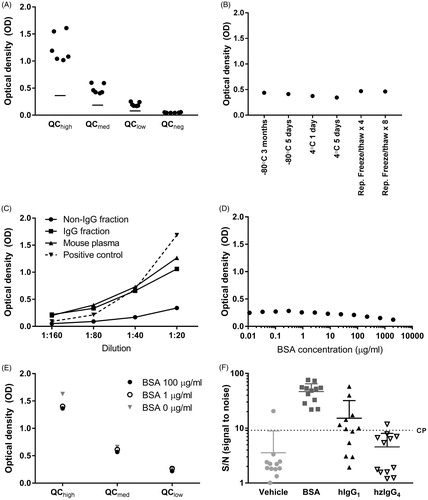
Table 1. Assay precision.