Figures & data
Figure 1. Histology of liver tissues. Samples were isolated from dams in each experimental group and processed and analyzed as noted in the methods. Representative slides from each group of animals is shown. (A) Control (peanut oil), (B) Aroclor 1254 (10 mg/kg) only, (C) Aroclor + 75 mg/kg quercetin, (D) Aroclor + 150 mg/kg quercetin, and (C) Aroclor + 300 mg/kg quercetin. Arrows indicate lipid droplet(s) presence. Hematoxylin-eosin (HE); magnification = 200×.
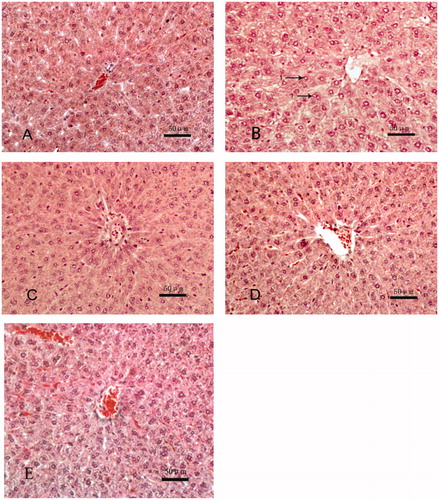
Table 1. Rat embryo implantation and delayed-development ratios.
Figure 2. CYP1A1 and CYP2B1 mRNA expression in rat liver samples (RT-PCR). All PCR-amplified products were evaluated under UV in a 2% agarose gel [containing ethidium bromide] by scanning with a Gel Doc image scanner. Evaluations of CYC housekeeping gene were done to permit normalization as needed for loading. Values shown in bar charts are in terms of relative intensity (i.e. vs. CYC level). Values shown are means ± SD (n = 8/group). *Value significantly different from control (*p < 0.05, **p < 0.01). Each experiment was repeated three times; figure shown is representative outcome. Doses in upper figure in terms of mg/kg. Treatments A-E described in legend to .
![Figure 2. CYP1A1 and CYP2B1 mRNA expression in rat liver samples (RT-PCR). All PCR-amplified products were evaluated under UV in a 2% agarose gel [containing ethidium bromide] by scanning with a Gel Doc image scanner. Evaluations of CYC housekeeping gene were done to permit normalization as needed for loading. Values shown in bar charts are in terms of relative intensity (i.e. vs. CYC level). Values shown are means ± SD (n = 8/group). *Value significantly different from control (*p < 0.05, **p < 0.01). Each experiment was repeated three times; figure shown is representative outcome. Doses in upper figure in terms of mg/kg. Treatments A-E described in legend to Figure 1.](/cms/asset/3a7746fc-ef0b-443f-80b6-d9c47cdc3b96/iimt_a_1604585_f0002_b.jpg)
Figure 3. CYP1A1 and CYP2B1 protein in rat liver samples (homogenates; Western blot). Evaluation of CYC was performed to permit normalization as needed for loading. Values shown in bar charts are in terms of relative intensity (i.e. after normalizing, vs. control rat value). Values shown are means ± SD (n = 8/group). *Value significantly different from control (*p < 0.05, **p < 0.01). Each experiment repeated three times; figure shown is representative outcome. Doses in upper figure in terms of mg/kg. Treatments A–E described in legend to .
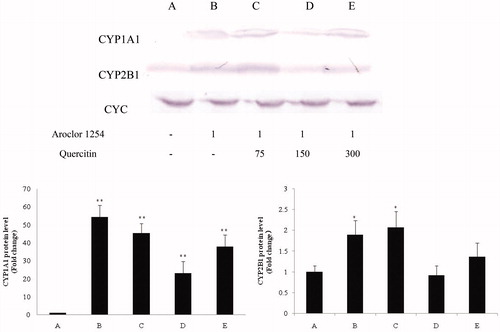
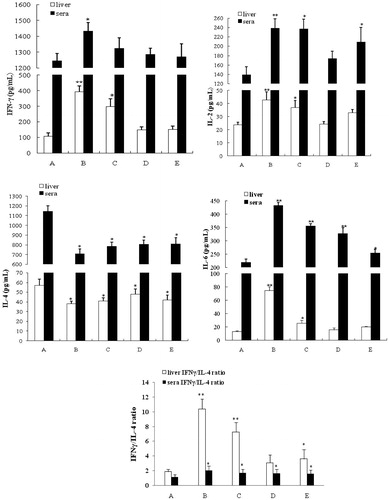
Figure 4. IFNγ, IL-2, IL-4, and IL-6 levels in rat liver tissue homogenates and sera. IFNγ/IL-4 ratio for each sample group is also presented (bottom). Values shown are means ± SD (n = 8/group). *Value significantly different from control (*p < 0.05, **p < 0.01). Treatments A–E described in legend to .