Figures & data
Table 1. Grading of response for erythema and edema for phototoxicity and photoallergic reaction studies.
Table 2. Grading of response for skin sensitization and cumulative skin irritation studies.
Table 3. Subject disposition.
Table 4. Baseline demographics and characteristics.
Figure 1. Mean response score for FMX101 4% and vehicle, at irradiated and nonirradiated sites, as well as irradiated and untreated sites, at 3 and 24 hr postpatching (phototoxicity study).
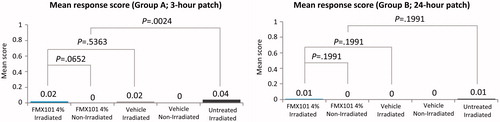
Figure 2. Mean irritation score during the induction phase for FMX101 4% and vehicle, at both irradiated and nonirradiated sites (photoallergy study).
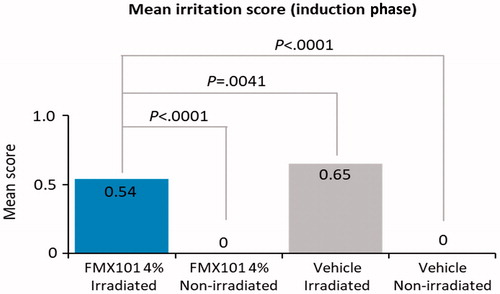
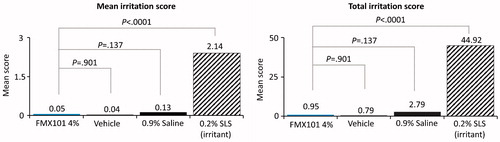
Figure 3. Mean and total irritation score for FMX101 4%, vehicle, 0.9% saline (negative control), and 0.2% SLS (positive control) (skin sensitization study).
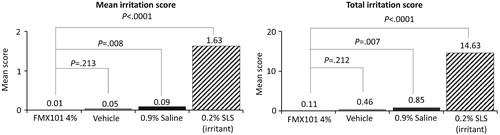
Table 5. Summary of adverse events (AE).
Figure 4. Mean daily and total irritation score for FMX101 4%, vehicle, 0.9% saline (negative control), and 0.2% SLS (positive control) (cumulative skin irritation study).