Figures & data
Figure 1. Effects of DEHP exposure on OVA-sensitized weanling mice spleen Tfh cell surface receptor SLAMF1 expression. (A) Expression percentage of CXCR5+SLAMF1+ Tfh cells gated on CD4+ T-cell populations (%) (flow cytometry). (B) SLAMF1 mRNA expression (normalized to Gapdh; real-time qRT-PCR). Data shown are means ± SD, n = 8 mice/group. **p < 0.01, ***p < 0.001 vs. corn oil + OVA control group.
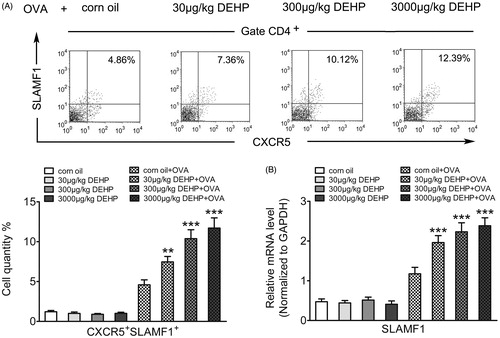
Figure 2. Effects of DEHP exposure on OVA-sensitized weanling mice spleen Tfh cell adaptor protein SAP expression. (A) SAP protein expression (ratio to GAPDH; Western blot). (B) SAP mRNA expression (normalized to Gapdh; real-time qRT-PCR). Data shown are means ± SD, n = 8 mice/group. ***p < 0.001 vs. corn oil + OVA control group.
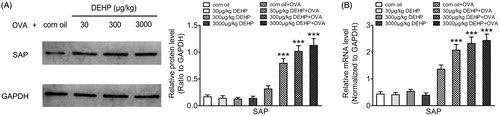
Figure 3. Influence of Slamf1 siRNA transfection (with DEHP exposure) on Tfh cell adaptor protein SAP expression. (A) SLAMF1 protein (Western blot) and SLAMF1 mRNA expression (real-time qRT-PCR). (B) SAP protein expression (ratio to GAPDH; Western blot). (C) SAP mRNA expression (normalized to Gapdh; real-time qRT-PCR). Data shown are means ± SD, n = 6 samples/group. ※※※p < 0.001 vs. control group or NC siRNA group; ▲▲▲p < 0.001 vs. control group; ▼▼▼p < 0.001 vs. DEHP exposure group or DEHP + NC siRNA group; ns = p > 0.05 vs. control group or NC siRNA group.
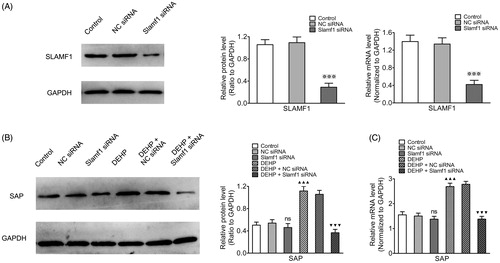
Figure 4. Influence of Slamf1 siRNA transfection (with DEHP exposure) on Tfh cell nuclear transcription factor expression. (A) Expression percentages of CXCR5+BCL-6+ and CXCR5+c-MAF+ Tfh cells gated on CD4+ T-cell populations (%) (flow cytometry). (B) Bcl-6 and c-MAF mRNA (normalized to Gapdh; real-time qRT-PCR). Data shown are means ± SD, n = 6 samples/group. ▲▲p < 0.01, ▲▲▲p < 0.001 vs. control group; ▼▼▼p < 0.001 vs. DEHP exposure group or DEHP + NC siRNA group; ns = p > 0.05 vs. control group or NC siRNA group.
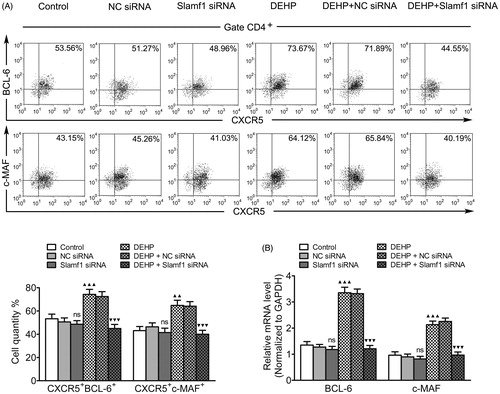
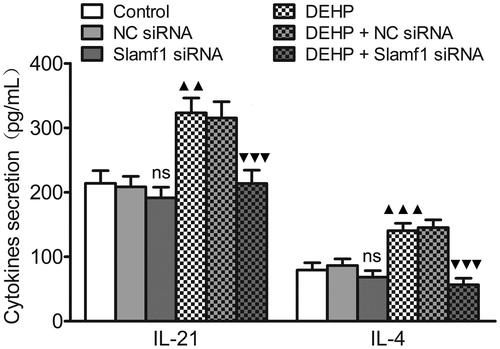
Figure 5. Influence of Slamf1 siRNA transfection (with DEHP exposure) on Tfh cell cytokine secretion. Levels of IL-21 and IL-4 in Tfh cell culture supernatants as measured by ELISA. Data shown are means (pg/ml) ± SD, n = 6 samples/group. ▲▲p < 0.01, ▲▲▲p < 0.001 vs. control group; ▼▼▼p < 0.001 vs. DEHP exposure group or DEHP + NC siRNA group; ns = p > 0.05 vs. control group or NC siRNA group.