Figures & data
Table 1. Demographic and exposure characteristics of study children and mothers (N = 51).
Table 2. Multivariable adjusted linear regression analysis of the association between urinary/water As and plasma LL-37, stratified by sex and anthropometric Z-score.
Table 3. Association of As exposure with culture supernatant cyto-/chemokine levels (n = 16).
Figure 1. Association of tertiles of %MMA with (A) plasma LL-37, (B) MDM killing capacity, and (C) serum bactericidal antibody (SBA) response, stratified by sex. “p” was determined by multi-variate-adjusted regression analysis and the model was adjusted by child age, sex, WAZ (weight for age z-score), and mother BMI (body mass index). Plasma LL-37 concentrations in the second tertile of %MMA was significantly higher than the lowest tertile (reference group) in girls (*p = 0.05). MDM-mediated killing capacity was significantly lower (*p = 0.05) in the highest fraction of MMA compared to the lowest. SBA responses in the second tertile of %MMA was significantly lower than the first tertile in all children (*p = 0.02) and in girls (*p = 0.03). MMA: mono-methylarsonic acid; MDM: monocyte-derived macrophage; SBA: serum bactericidal antibody response.
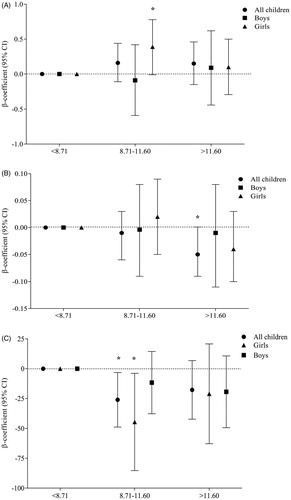
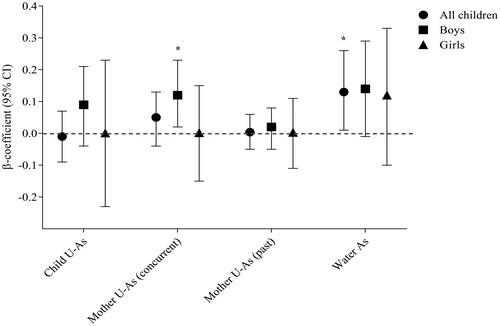
Figure 2. Association of arsenic exposure (child U-As, mother’s concurrent U-As, mother’s past U-As, and household water arsenic) with SBA response. Analysis was performed stratifying by sex. “p” was determined by multivariate-adjusted regression analysis and the model was adjusted by child age, sex, WAZ (weight for age z-score), and mother BMI (body mass index). Significant positive associations were obtained between household W-As and SBA response in all children (*p = 0.04) and between maternal U-Asconcurrent and SBA response in boys (*p = 0.02).