Figures & data
Figure 1. Surface of rat colon mucosa with mucus in CV- and GF-reared animals. (A) CV rat colon mucosa with evidence of bacteria (also evidenced in circle and by arrows). (B) GF rat colon mucosa with no evidence of bacteria. Confocal microscopy was performed on fresh samples using RM imaging. Original magnification = 43X.
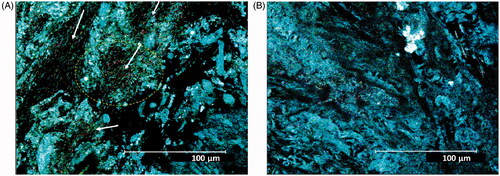
Figure 2. Transversal section of colon mucosa in (A, C) CV and (B, D) GF rats. The represent-ative images show differences in the inter-cryptal spaces and organization of the collagen fibers (see text). The immune cells in the spaces within the crypts (A,B: dark dots) are more represented in the CV rat mucosa (in accordance with a presence of commensal microflora) than in the GF rat mucosa. (C,D) Aspect of mucosa in fresh samples examined by confocal microscopy reflectance mode technique. (A and B) Samples are colon mucosa sections with picrosirius staining of collagen (red). Magnification = 40X.
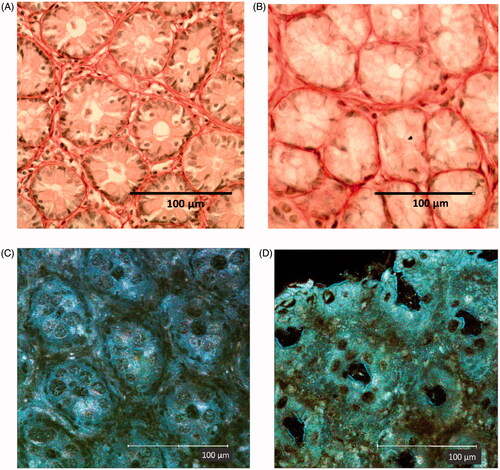
Figure 3. Collagen scaffold of left colon mucosa in (A, C) CV and (B, D) GF rats using SHG in multiphoton confocal microscopy. (A,B) Structure of collagen scaffold sustaining crypts is shown. (C,D) Intra-mucosal lymphatic follicles are shown. Different complexity and collagen fiber conformation is evident between microbiome-trained mucosa vs. axenic mucosa. (E,F) Same place in RM in 1-photon confocal microscopy. (G,H) Other intra-mucosal follicles confirming the lower complexity and dimension of the structure in (H) GF rat mucosa are shown. (I) Sample in A is imaged by RM, and then merged with SHG image (here in yellow). Degree to which immune cells are in relation with/oriented by disposition of the scaffold fibrous structure is evident. (J) Immune cells can find a place in limited numbers and in tight contact inside slots created by complex structure of well-developed intra-mucosal follicles of CV rats. (A, I) CV left colon mucosa, magnification 43X. (B) GF left colon mucosa (43X). (C, E) CV Left colon follicle (20X). (D, F) GF Left colon follicle (43X). (G) CV Right colon follicle (20X). (H) GF right colon follicle (43X). (I) RM imaging, 1-photon confocal microscopy merged with SHG image (original magnification 43X). (J) Merged RM, SHG imaging and fluorescence detection of Draq5 nuclear staining of immune cells performed on fresh tissue: particular of a lymphatic follicle in CV left colon mucosa (original magnification 63X).
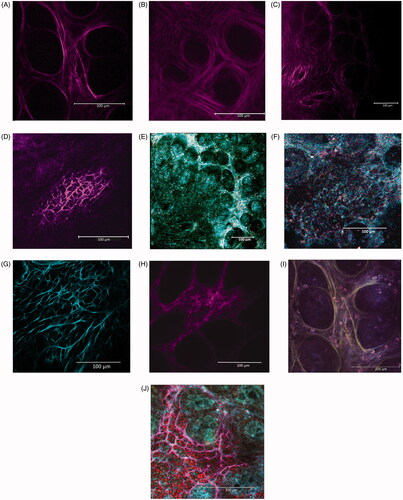
Figure 4. Imaging results. Confocal imaging was analyzed by various criteria, from which integrated density values were found to be significantly higher in CV rats (p = 0.0209). Distances between centers of the crypts were significantly higher in GF rats (p = 0.0007). The opposite trend was found in skewness, which was higher in CV rats (p < 0.0001). Differences in inter-cryptal spaces between CV and GF rats were non-significant. Significance: *p < 0.05, **p < 0.01, and ***p < 0.001.
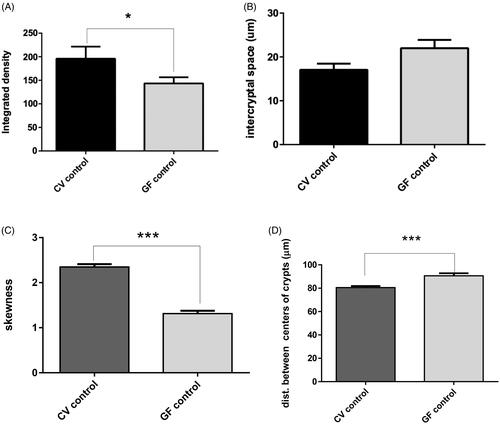
Figure 5. Spontaneous cytokine levels. Right and left colon of CV and GF rats (full mucosa samples). IL-1α production was significantly higher in right colon mucosa of CV rats (p = 0.0131); same trend was found in TGFβ1 production (p = 0.0305), while IL-6 was significantly higher in left colon mucosa of GF rats. Differences in the production of other cytokines were non-significant. Data reported as pg/ml. Significance: *p < 0.05, **p < 0.010 and ***p < 0.001.
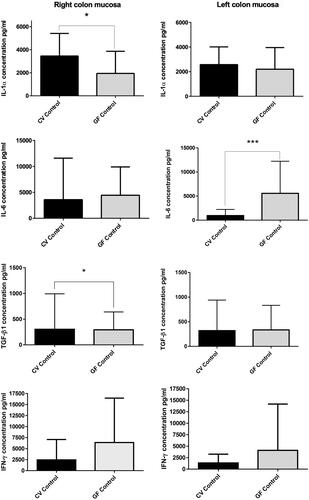
Figure 6. Spontaneous cytokine levels. (A, C, E, G) Mesenteric lymph nodes and (B, D, F, H) Spleen of CV and GF rats. Significant differences in production were found for TGFβ1 and IFNγ; TGFβ1 was higher in spleen of CV rats (p = 0.0016) and IFNγ was higher in MLN of CV rats (p = 0.021). Data reported as pg/ml. Differences in production of cytokines in other tissues were non-significant. Significance: *p < 0.05, **p < 0.01, and ***p < 0.001.
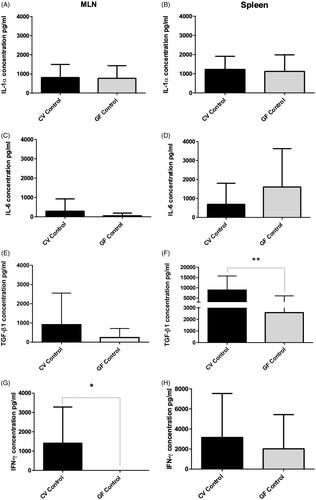
Figure 7. FACS analysis of immune cell sub-populations in peripheral blood of CV and GF rats. Analysis of immune cells showed significantly higher populations of NK cells in GF rats (p = 0.019); same trend was found for TH cells (p < 0.0001), while levels of cytotoxic T-cells were slightly higher in CV rats (p = 0.0465). Differences in other immune cell sub-populations were not significant. Significance: *p < 0.05, **p < 0.01, and ***p < 0.001.
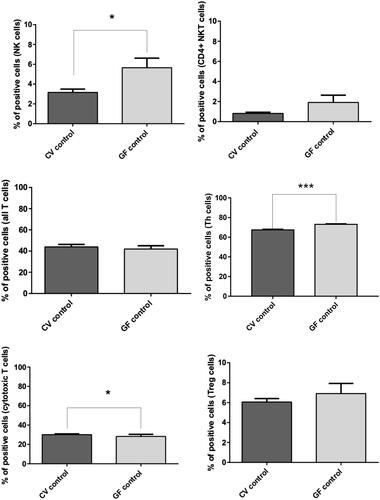
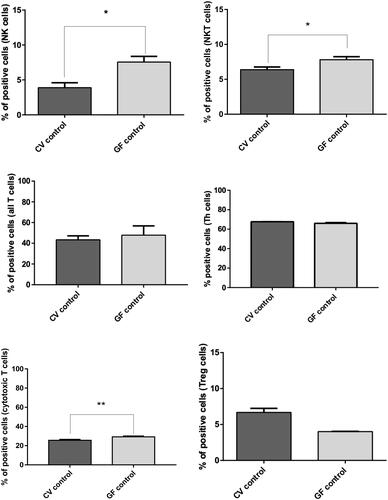
Figure 8. FACS analysis of immune cell sub-populations in spleens of CV and GF rats. Analysis of immune cells revealed a significantly higher population of NK (p = 0.038) and NKT (p = 0.022) cells in the GF rats. The opposite trend was observed for cytotoxic T-cells, i.e., higher in CV rats (p = 0.0095). Differences in other immune cell sub-populations were non-significant, even though Treg cells appeared basically more represented in CV rats. Significance: *p < 0.05, **p < 0.01, and ***p < 0.001.