
Figures & data
Figure 1. Cell viability. Viability was determined by an Alamar blue assay after 24-h exposure of three cell culture systems (HaCaT or THP-1 mono-cultures and HaCaT/THP-1 co-culture) with different concentraions (µg/ml) of CoCl2, MI, and PPD. Each bar represents mean ± SE of four experiments. Statistical analysis: one-way ANOVA or Bonferroni’s multiple comparison. Value significantly different from unexposed/control cells, ***p ≤ 0.001.
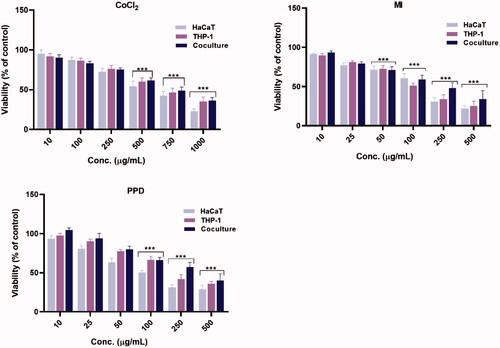
Figure 2. Effect of CoCl2 on secretion of pro-inflammatory cytokines in the three culture systems. IC20 concentrations used; HaCaT= 117.5, THP-1 = 128.7 and co-culture= 101.5 µg/ml. Assessment of cytokines was performed after 24 h of exposure. Each bar (n = 4, mean ± SE) represents the concentration of the mediator (pg/ml). Statistical analysis: one-way ANOVA or Bonferroni’s multiple comparison. Value significantly different from corresponding control: *p ≤ 0.05, **p ≤ 0.01.
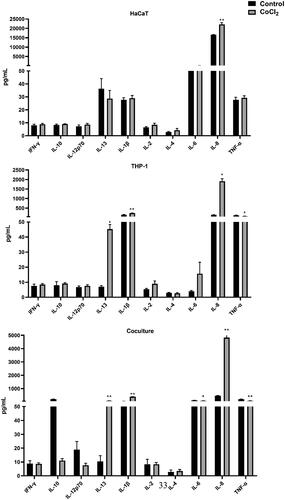
Figure 3. Effect of MI on secretion of pro-inflammatory cytokines in the three culture systems. IC20 concentrations used; HaCaT = 25.1, THP-1 = 16.5 and co-culture = 17 µg/ml. Assessment of cytokines was performed after 24 h of exposure. Each bar (n = 4, mean ± SE) represents the concentration of the mediator (pg/ml). Statistical analysis: one-way ANOVA or Bonferroni’s multiple comparison. Value significantly different from corresponding control: *p ≤ 0.05, **p ≤ 0.01.
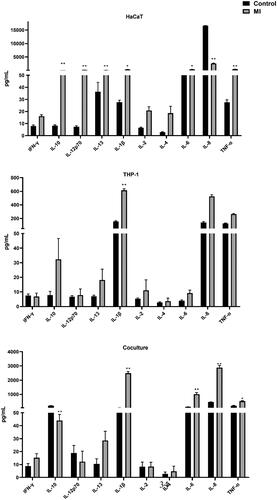
Figure 4. Effect of PPD on secretion of pro-inflammatory cytokines in the three culture systems. IC20 concentrations used; HaCaT = 15.0, THP-1 = 38.0 and co-culture= 77.7 µg/ml. Assessment of cytokines was performed after 24 h of exposure. Each bar (n = 4, mean ± SE) represents the concentration of the mediator (pg/ml). Statistical analysis: one-way ANOVA or Bonferroni’s multiple comparison. Value significantly different from corresponding control: *p ≤ 0.05, **p ≤ 0.01.
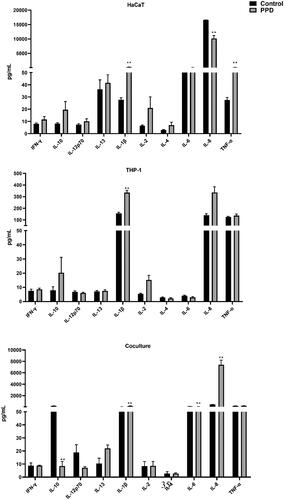
Table 1. Summary of cytokine responses.
Table 2. Summary of cytokine responses to control agents.