
Figures & data
Table 1. The 23 chemicals are present in equimass proportions in the drinking water.
Table 2. Primary and secondary immune organ cell populations from immunologically-naïve female and male mice.
Table 3. Primary and secondary immune organ cell numbers in immunologically-naïve female and male mice.
Figure 1. Effects of exposure to 23-chemical mixture on CD8+ T-cells and morbidity after viral infection. Starting at 6 week-of-age, C57Bl/6 mice were placed on drinking water containing an equimass mixture of 23 chemicals () or vehicle. The final concentration of each chemical in the water was 0.1 µg/ml; control water contained 0.2% ethanol. Mice were maintained on these regimens for at least 8 weeks before infection. After 8 weeks of exposure, 10 female and 10 male mice from each exposure group were infected intranasally (IN) with IAV (H3N2). Mice were maintained on their respective water treatment regimens throughout infection. (A,C) Mean change in body weight of (A) female and (C) male mice following infection. (B,D–H) CD8+ T-cells were examined 9 days post-infection in female mice, and 8 days after infection in male mice, using flow cytometry. Mean number of CD8+ T-cells in mediastinal lymph nodes (MLN) of infected (B) female and (D) male mice. Mean number of cytotoxic T-lymphocytes (CTL; CD8+CD44hiCD62Llo cells) in IAV-infected (E) female and (G) male mice from each group. Mean number of IAV NP-specific CD8+ T-cells (DbNP366-375+CD8+ T-cells) in infected (F) female and (H) male mice. *Significantly different compared to same-sex control mice (p < 0.05; Student’s t-test). Data presented as means ± SEM. Numerical values that correspond to graphs, as well as p-values for each comparison, are listed in Tables S2, S3.
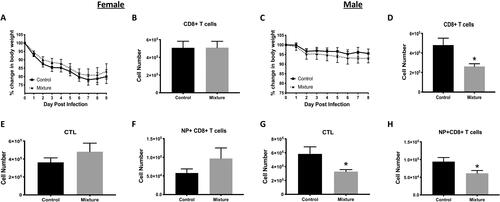
Figure 2. Consequences of mixture exposure on CD4+ T-cells during viral infection. Starting at 6 week-of-age, C57Bl/6 mice were placed on drinking water containing a mixture of 23 chemicals or containing vehicle control, and 10 female and 10 male mice from each exposure group were infected with IAV at least 8 weeks later (see ). CD4+ T-cell responses were measured 9 and 8 days after infection in, respectively, the female and male mice. Cell suspensions of MLN cells were prepared and stained for flow cytometry. CD4+ T-cells were defined as CD3+CD4+; CD4+ T-cell subsets were further defined using the following markers: TBet+ (TH1 cells), RORγt+ (TH17 cells), PD1+CXCR5+ (Tfh cells), and Foxp3+CD25+ (Treg cells). Bar graphs shows numbers of (A,F) CD4+ T, (B,G) TH1, (C,H) TH17 (C,H), (D,I) Treg, and (E,J) Tfh cells in, respectively, infected female and male mice. *Significantly different compared to same-sex control mice (p < 0.05; Student’s t-test). Data presented as means ± SEM. Numerical values that correspond to graphs, as well as p-values for each comparison, are listed in Tables S2, S3.
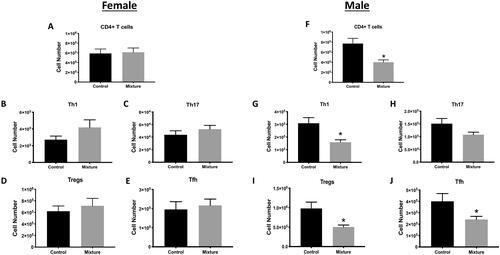
Figure 3. EAE disease symptom onset and severity. Following 8 weeks of exposure to the chemical mixture or vehicle control, 10 female and 10 male mice from each exposure group were immunized with CFA/MOG35–55 emulsion. Disease progression was monitored and scored every other day for 42 days. The average disease score for each treatment group over time was determined in (A) female, and (D) male mice. Graphs also depict the day of disease onset (disease score ≥ 1) in (B) female, (E) male, and the average day of onset in (C) female and (F) male mice. Disease scores were 0 = normal mouse, 1 = limp tail, 2 = limp tail and hind limb weakness, 3 = partial hind limb paralysis, 4 = complete hind limb paralysis, 5 = moribund. *Significantly different compared to control mice (p < 0.05; ANOVA). Data presented as means ± SEM.
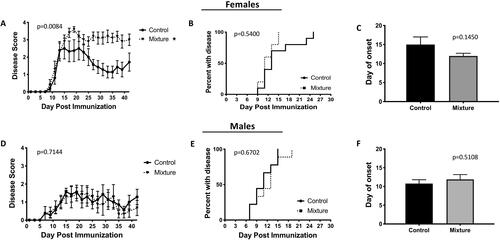
Figure 4. CD4+ T-cell subsets in EAE disease. Following 8 weeks of exposure to the mixture of 23 chemicals or water containing the vehicle control, 10 female and 10 male mice in each exposure group were immunized with CFA/MOG35–55 emulsion to induce EAE (see ). All mice were euthanized 42 days after immunization, and cervical lymph nodes were then obtained. (A,C,E,G) Mean number and (B,D,F,H) percentage of TH1 (TBet+CD4+CD3+ cells) and TH17 (RORγt+CD4+CD3+) cells based on flow cytometry. (I,L) Mean number of Treg cells (Foxp3+CD25+ CD4+ CD3+) in (I) female and (L) male mice. (J,M) Mean Treg:TH1 ratios in (J) female and (M) male mice. (K,N) Mean Treg:TH17 ratios in (K) female and (N) male mice. *Significantly different compared to control mice (p < 0.05; Student’s t-test). Data presented as means ± SEM. Numerical values that correspond to graphs, as well as p-values for each comparison, are listed in Tables S4, S5.
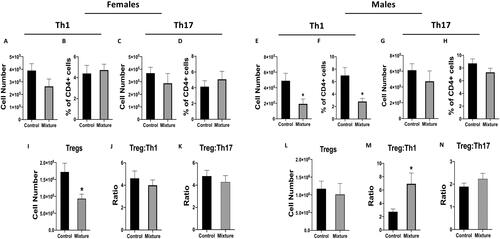
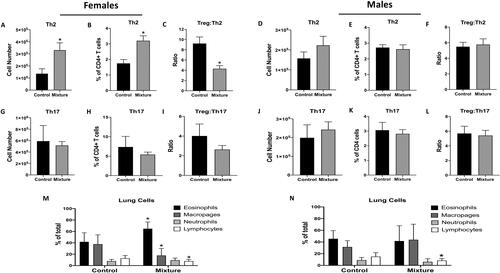
Figure 5. Effects of exposure to chemical mixture on immune response in an allergic airway disease model. Following 10 weeks of exposure to the mixture or vehicle control, 10 female and eight male mice in each exposure group were sensitized and challenged with HDM. To assess CD4+ T-cell subsets in their MLN, mice were euthanized 10 days after HDM administration. MLN of female mice: mean (A,G) number, (B,H) percentage, and (C,I) ratios of indicated CD4+ T-cell types based on flow cytometry. MLN of male mice: mean (D,J) number, (E,K) percentage, and (F,L) ratios of indicated CD4+ T-cell types. Airway leukocytes were examined via broncho-alveolar lavage (BAL); mean percentage neutrophil, lymphocyte, macrophage, and eosinophil in BAL from (M) female and (N) male mice. *Significantly different compared to control mice (p < 0.05; Student’s t-test). Data presented as means ± SEM. Numerical values that correspond to graphs, as well as p-values for each comparison, are listed in Tables S6, S7.
Supplemental Material
Download MS Word (73.9 KB)Data availability statement
Data will be provided to interested parties based on reasonable requests to the corresponding author (BPL). All flow cytometry standard (FCS) files used to generate the data included in this paper are available in the NIH Figshare Repository (accession number to follow upon manuscript acceptance).