Figures & data
Figure 1. Epicutaneous papain sensitization on back skin of mice induced skin inflammation, serum papain-specific IgE and IgG1, and differentiation of TH2 and TH17 cells. (a) Timeline. (b) Serum antibodies. (c) Cytokine production in DLN cells restimulated with E64-papain. (d) Histology (hematoxylin-eosin staining). (e) Gene expression in back skin. Data shown are means ± SD of 4 (b,e) or 3-6 mice/group (c) and represent three independent experiments with similar results. *p < 0.05 vs. vehicle (b,e) or no restimulation (c) by Mann-Whitney U-test. Scale bar = 50 µm.
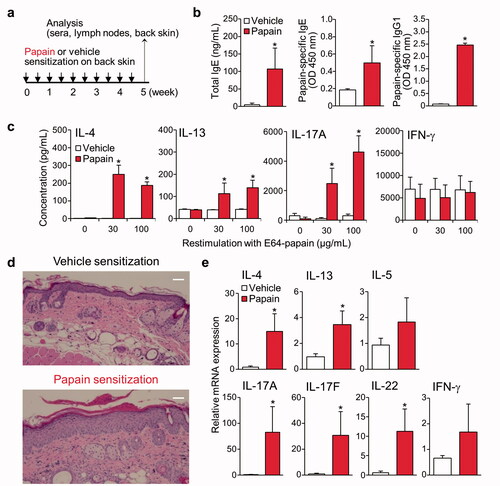
Figure 2. Epicutaneous papain challenge on the ear skin stimulated TH2 and TH17/TH22 cytokine gene expression and triggered mast cell degranulation in a manner dependent on the epicutaneous presensitization. (a) Timeline. (b) Gene expression in ear skin before and after challenge. Data shown are means ± SD of 4-6 mice/group and represent three independent experiments with similar results. *p < 0.05 vs before challenge, #p < 0.05 vs vehicle (Mann-Whitney U-test). (c) Toluidine blue staining. Red arrows show degranulated mast cells. Scale bar = 50 µm. (d) RORγt IHC staining of ear skin before papain challenge. Red dotted line circles indicate positively-stained cells. Scale bar = 100 µm.
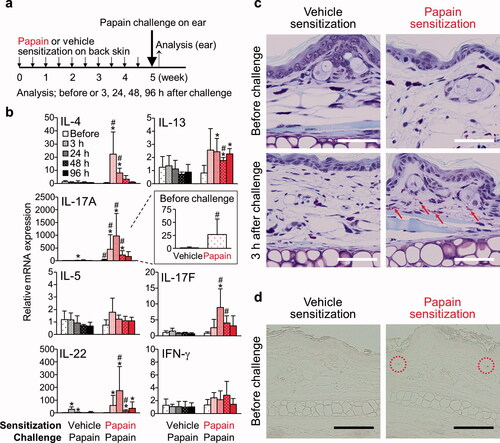
Figure 3. Epicutaneous papain challenge on the ear skin after pre-sensitization stimulated TH2 and TH17/TH22 cytokine gene expression in a manner dependent on protease activity. (a) Timeline. (b) Protease assay for papain or E64-papain. (c) Gene expression in ear skin before and after papain or E64-papain challenge. Data shown are means ± SD of 4 mice/group. * p < 0.05 vs before challenge, # p < 0.05 vs vehicle (Mann-Whitney U-test).
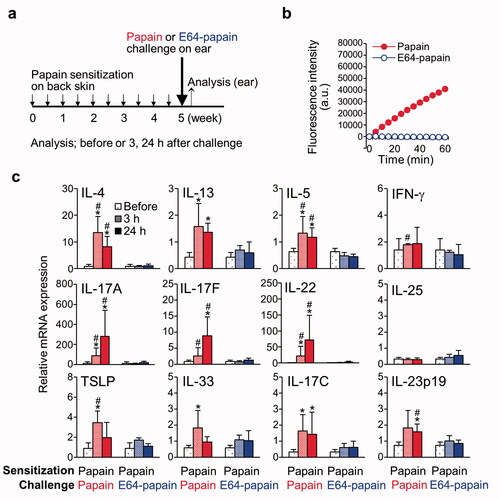
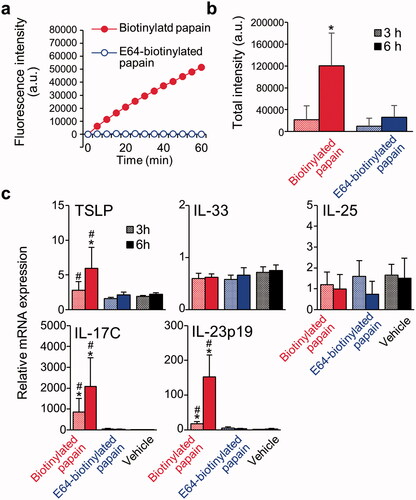
Figure 4. Papain, but not E64-papain, penetrated reconstructed human epidermis and stimulated TSLP, IL-17C, and IL-23p19 gene expression. (a) Protease assay for biotinylated papain or E64-biotinylated papain. (b) Permeability of biotinylated papain and E64-biotinylated papain. (c) Gene expression of cytokines that induce TH2/TH17 cell differentiation or stimulate TH2/TH17 cell cytokine production. Data shown are means ± SD of 6 wells/group. * p < 0.05 vs. E64-biotinylated papain (Mann-Whitney U-test) (b). * p < 0.05 vs vehicle, # p < 0.05 vs. E64-biotinylated papain by analysis of variance (c) followed by Tukey-Kramer post-hoc test.