
Figures & data
Table 1. Comparison of different mAM isolation protocols.
Figure 1. Effects of injected buffer volume and composition for BALF collection on particle-induced IL-1α release from isolated mAM. (A) mAM obtained from BALF collected using each injection buffer volume (1.0 or 0.75 ml) or compositions were stimulated ex vivo with 100 µg/ml alum. After 6 h, cell-free supernatants were collected, and IL-1α and IL-6 concentrations assessed by ELISA. (B) mAM obtained from BALF collected using each injection buffer volume (0.55, 0.75, or 1.0 ml) were stimulated ex vivo with 100 µg/ml alum, crystalline silica particles, or LPS for 6 hr. Cell-free culture supernatants were collected, and IL-1α and IL-6 concentrations assessed by ELISA. (C) Cells in each well were isolated, pelleted, and then lysed with RIPA buffer. IL-1α and total protein concentrations were measured by ELISA and BCA assay, respectively. (D) Cell viability was assessed by measuring LDH activity in cell-free supernatant. All data shown are means (± SEM) of three independent experiments. Statistical significance assessed by one-way ANOVA and Dunnett’s multiple-comparison test to determine differences between PBS only and other groups. *p < 0.05, **p < 0.01, ***p < 0.001 versus the saline or PBS group.
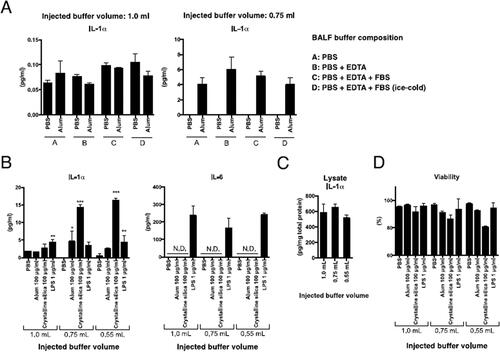
Figure 2. Number and morphology of cells obtained from BALF collected using each injection buffer volume. (A) Total cell numbers in harvested BALF were determined. (B) Aliquots were then placed on slides and stained with May–Grünwald–Giemsa. (C) Thirty minutes after initiating mAM culture, cell images were acquired by phase contrast microscopy. Black arrows in (B) indicate alveolar epithelial cells. Data shown in (A) are means (± SEM) of four independent experiments.
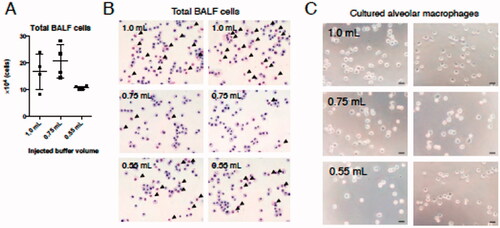
Figure 3. Characterization of mAM collected using the differing buffer volumes. (A) Cell surface antigen expression on cells analyzed by FACS. Percentage of mAM among total cells is shown as a representative dot-plot. (B) Viability assessed by LDH assay. (C) HMC Class II expression analyzed by FACS. In graphs, each dot indicates result for an individual animal; mean of three independent experiments is indicated by horizontal line. Data shown are means (± SEM) of four independent experiments. Significance of differences between 1.0 ml and other groups assessed by one-way ANOVA and Dunnett’s multiple-comparison test. ***p < 0.001 and *p < 0.05 versus the 1.0 ml group.
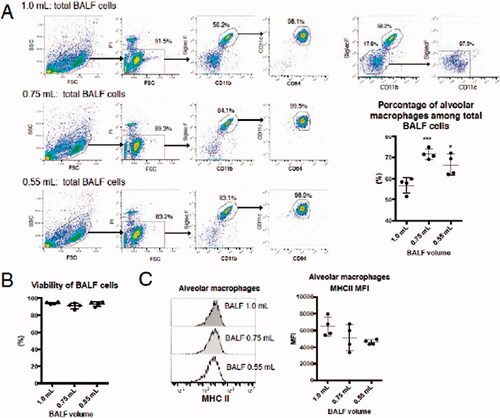
Figure 4. Effects of injected buffer volume on mAM viability during culture. Isolated mAM were seeded in uncoated dishes and cell viability assessed. (A) Viability assessed via cell morphology 24 h after seeding and by (B) LDH assay 24 and 48 h after seeding. Data shown in (B) are means (± SEM) of three independent experiments. Significance between 1.0 ml and other groups assessed by one-way ANOVA and Dunnett’s multiple-comparison test. **p < 0.01 versus the 1.0 ml group.
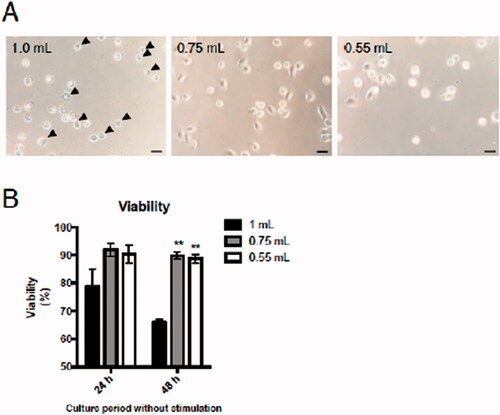
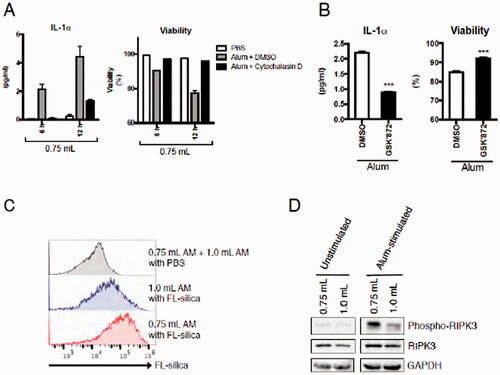
Figure 5. Effects of injected buffer volume on ex vivo IL-1α secretion by mAM in the context of changes in particle uptake activity and/or RIPK3-dependent necroptosis. (A) mAM isolated using 0.75 ml buffer stimulated 6 h with 100 µg/ml alum with or without 2 µM cytochalasin D. (B) mAM isolated using 0.75 ml buffer stimulated 6 h with 100 mg/ml alum with or without 5 µM GSK’872. In each case, DMSO was used as a vehicle control for inhibitor. Cell-free supernatants were then measured for IL-1α and cell viability. (C) mAM isolated from BALF collected using 0.75 or 1.0 ml buffer were stimulated 4 h with 100 µg/ml FL-silica, after which the cells were analyzed by FACS to assess silica uptake/cell by fluorescence intensity. As a control, PBS-treated mAM obtained from BALF collected using 1.0 ml buffer and those isolated using 0.75 ml buffer were mixed 1:1 prior to FACS analyses. (D) mAM from BALF collected using 0.75 or 1.0 ml buffer were stimulated 4 h with 100 µg/ml alum. Cells were then lysed and p-RIPK3, total RIPK3, and GAPDH protein levels evaluated by immunoblot. Data shown in (A) and (B) are means (± SEM) of three independent experiments. ***p < 0.001.
Data availability statement
The authors confirm the data supporting the findings here are available within the article.