1,624
Views
1
CrossRef citations to date
0
Altmetric
Research Articles

Application of a newly-developed cynomolgus macaque BiTE-mediated cytotoxic T-lymphocyte activity assay to various immunomodulatory agents in vitro

, , &
Pages 154-162 | Received 18 Jul 2021, Accepted 08 Oct 2021, Published online: 29 Oct 2021

Figures & data

Figure 1. Illustration of BiTE®-mediated CTL assay. (1) EGFR expressing HCT-116 target cells and donor PBMC are co-cultured with α-EGFR × CD3 BiTE®. (2,3) Upon binding of BiTE® to both target cell and CD8+ T-lymphocyte, immunological synapse forms, and activation ensues. (4,5) Exocytic granules (marked by CD107a) containing perforin and granzymes along with IFNγ are then secreted, resulting in redirected lysis of target cell (5) (Created with BioRender.com).

Figure 1. Illustration of BiTE®-mediated CTL assay. (1) EGFR expressing HCT-116 target cells and donor PBMC are co-cultured with α-EGFR × CD3 BiTE®. (2,3) Upon binding of BiTE® to both target cell and CD8+ T-lymphocyte, immunological synapse forms, and activation ensues. (4,5) Exocytic granules (marked by CD107a) containing perforin and granzymes along with IFNγ are then secreted, resulting in redirected lysis of target cell (5) (Created with BioRender.com).

Figure 2. Immunosuppressive agents targeting T cell-intrinsic signals, proliferation, and activation reduced CTL activity. Percentage CD8+ T-cells with CD107a surface staining (left panel) and IFNγ production (right panel) were measured at different drug concentrations. Each data point is mean (±SD) from a single donor run in duplicate. Data are representative individual donors of multiple independent experiments with several donors (n). (A) Dexamethasone (n = 4). (B) Prednisolone (n = 6). (C) Tofacitinib (n = 4). (D) Ruxolitinib (n = 6). (E) Mycophenolic acid (n = 6). (F) Teriflunomide (n = 8). (G) Tacrolimus/FK506 (n = 5). (H) Rapamycin (n = 6). (I) Apremilast (n = 8). Drugs were tested in separate experiments.

Figure 2. Immunosuppressive agents targeting T cell-intrinsic signals, proliferation, and activation reduced CTL activity. Percentage CD8+ T-cells with CD107a surface staining (left panel) and IFNγ production (right panel) were measured at different drug concentrations. Each data point is mean (±SD) from a single donor run in duplicate. Data are representative individual donors of multiple independent experiments with several donors (n). (A) Dexamethasone (n = 4). (B) Prednisolone (n = 6). (C) Tofacitinib (n = 4). (D) Ruxolitinib (n = 6). (E) Mycophenolic acid (n = 6). (F) Teriflunomide (n = 8). (G) Tacrolimus/FK506 (n = 5). (H) Rapamycin (n = 6). (I) Apremilast (n = 8). Drugs were tested in separate experiments.

Table 1. Immunomodulatory agents and mechanisms of action.

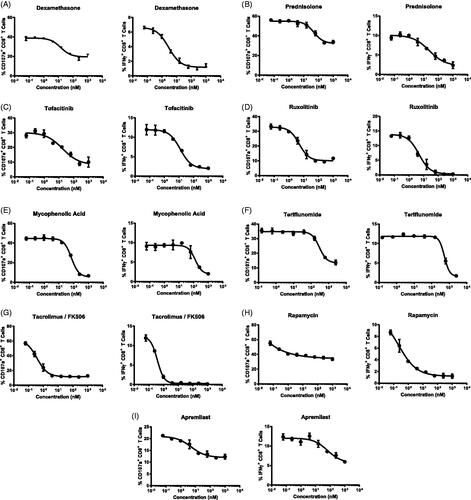
Table 2. IC50 values of immunosuppressant agents.

Figure 3. Biologics and compounds targeting cytokine or cytokine receptors, co-stimulation, or lymphocyte migration did not impact CTL activity in vitro. Percentage CD8+ T-cells with CD107a surface staining (left panel) and IFNγ production (right panel) were measured at different drug concentrations. Each data point is mean (±SD) from a single donor run in duplicate. Data are representative of individual donors of multiple independent experiments with several donors (n). (A) Adalumumab (n = 3). (B) Infliximab (n = 3). (C) Tociluzumab (n = 3). (D) Ustekinumab (n = 3). (E) Abatacept (n = 6). (F) Nataluziumab (n = 3). (G) Fingolimod/FTY720 (n = 6). Drugs were tested in separate experiments.

Figure 3. Biologics and compounds targeting cytokine or cytokine receptors, co-stimulation, or lymphocyte migration did not impact CTL activity in vitro. Percentage CD8+ T-cells with CD107a surface staining (left panel) and IFNγ production (right panel) were measured at different drug concentrations. Each data point is mean (±SD) from a single donor run in duplicate. Data are representative of individual donors of multiple independent experiments with several donors (n). (A) Adalumumab (n = 3). (B) Infliximab (n = 3). (C) Tociluzumab (n = 3). (D) Ustekinumab (n = 3). (E) Abatacept (n = 6). (F) Nataluziumab (n = 3). (G) Fingolimod/FTY720 (n = 6). Drugs were tested in separate experiments.

Figure 4. Anti-PD-1/PD-L1 immune checkpoint blockades enhanced CTL activity in vitro. Percentage CD8+ T-cells with CD107a surface staining (left panel) and IFNγ production (right panel) were measured at different drug concentrations. Each data point is mean (±SD) from a single donor run in duplicate. Data are representative of individual donors of multiple independent experiments with several donors (n). (A) Anti-PD-1 (n = 3). (B) Anti-PD-L1 (n = 3). Drugs were tested in separate experiments.

Figure 4. Anti-PD-1/PD-L1 immune checkpoint blockades enhanced CTL activity in vitro. Percentage CD8+ T-cells with CD107a surface staining (left panel) and IFNγ production (right panel) were measured at different drug concentrations. Each data point is mean (±SD) from a single donor run in duplicate. Data are representative of individual donors of multiple independent experiments with several donors (n). (A) Anti-PD-1 (n = 3). (B) Anti-PD-L1 (n = 3). Drugs were tested in separate experiments.
Supplemental material

Supplemental Material

Download PDF (697.1 KB)