Figures & data
Figure 1. Flow diagram of mouse model of skin sensitization by TCE. Note: Day 1: a mixture of 50% TCE and equal FCA solution was intradermally injected into the back of mice. On days 4, 7, and 10: 100 μl of a 50% TCE solution was applied on the same area of the back (resulting in three sensitizations). On days 17 and 19: 100 μl of a 30% TCE solution was applied to the same area of the back (resulting in two challenges). The TNFα antagonist R7050 (12 mg/kg) was intraperitoneally injected into select mice 2-h before TCE treatment. Day 20: Murine cutaneous reaction scoring was assessed. Day 22: All mice were euthanized and biosamples obtained. Note: 50% TCE (TCE: olive oil: acetone = 5:2:3); 30% TCE (TCE: olive oil: acetone = 3:2:5).
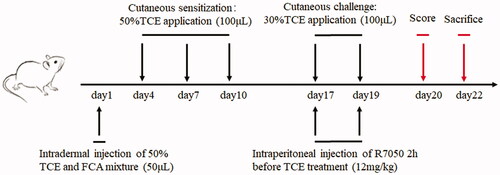
Table 1. Mouse groups and sensitization rates.
Figure 2. Cutaneous pathological changes of TCE-sensitized mice. (A) Blank control, (B) Vehicle control, (C) TCE+, and (D) TCE− mice. Black arrow shows epidermal thickening and keratinocyte edema in TCE-sensitized mice. Magnification 400×. Scale bars = 50 μm.
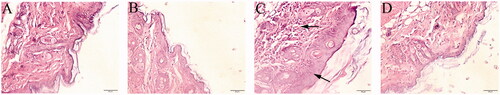
Figure 3. Renal pathological and functional changes in TCE-sensitized mice. (A) Blank control, (B) Vehicle control, (C) TCE+ and (D) TCE− mice. Black arrow shows tubular cell swelling, interstitial edema, or structural rearrangement of renal tubules. Magnification, 400×. Scale bars = 50 μm. Mouse serum levels of (E) α1-MG and (F) β2-MG. All data shown are means ± SD. Level of significance *p < 0.05. A representative image is presented for each group.
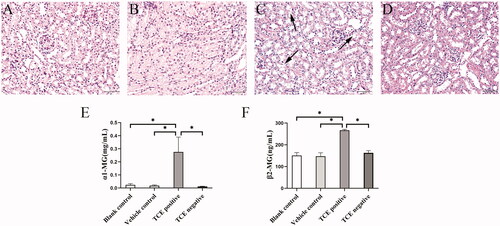
Figure 4. TCE sensitization-induced renal tubular epithelial cell damage in mice. (A) Rupture of cell membrane, (B) rough endoplasmic reticulum broken and expanded, and (C) Mitochondrial rupture and edema in RTEC of TCE-sensitized mice. A representative image is presented.
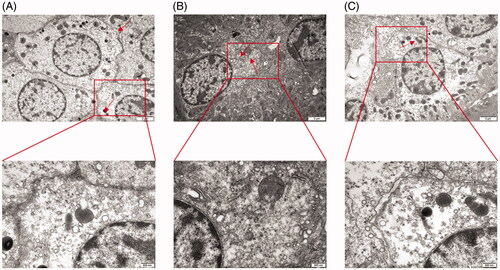
Figure 5. Co-location analysis of key necroptosis molecules in kidney of TCE-sensitized mice. (A) p-RIPK3 staining as Red, (B) CK18 staining as marker of renal tubular epithelial cells, (C) DAPI staining as blue. (D) Overlap of A–C. (E) p-MLKL staining as Red, (F) CK18 staining as marker of renal tubular epithelial cells, (G) DAPI staining as blue. (H) Overlap of E–G. Magnification 400×. Scale bars = 50 μm.
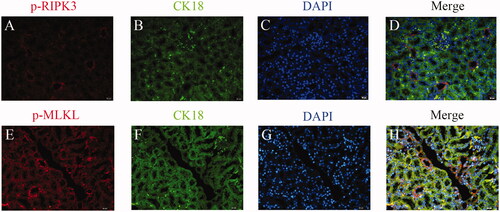
Figure 6. Expression of p-RIPK3 in RTEC of TCE-sensitized mice by immunofluorescence. (A) Blank control, (B) Vehicle control, (C) TCE+, (D) TCE−, (E) TCE + R7050+ group, (F) TCE + R7050− group. Red: p-RIPK3; Green: CK-18; Blue: DAPI. Magnification 400×. Scale bars = 50 μm.
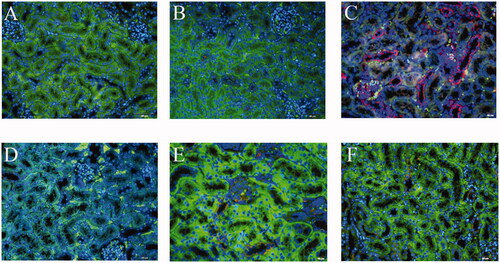
Figure 7. Expression of p-MLKL in RTEC of TCE-sensitized mice by immunofluorescence. (A) Blank control, (B) Vehicle control, (C) TCE+, (D) TCE−, (E) TCE + R7050+ group, (F) TCE + R7050− group. Red: p-MLKL; Green: CK-18; Blue: DAPI. Magnification 400×. Scale bars = 50 μm.
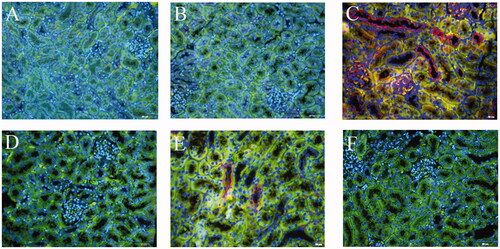
Figure 8. p-RIPK3 and p-MLKL expression in TCE-sensitized mice RTEC. (A) Representative immunoblot of central molecules of necroptosis in mice kidneys. Relative expression of (B) p-RIPK3 and (C) p-MLKL normalized to GAPDH. All data shown as means ± SD. Level of significance *p < 0.05.
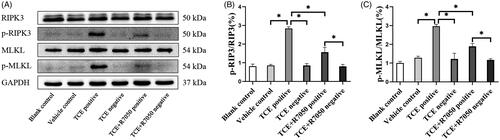
Figure 9. Local expression of TNFα in mice kidneys. (A) Blank control, (B) Vehicle control, (C) TCE+, (D) TCE−, (E) TCE + R7050+, (F) TCE + R7050− mice. Magnification 400×. Scale bars = 50 μm. Representative blots from each group are shown.
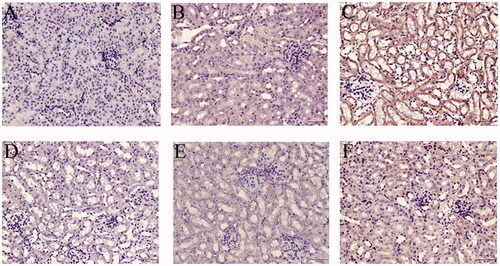
Figure 10. Local expression of TNFR1 in mice kidneys. (A) Blank control, (B) Vehicle control, (C) TCE+, (D) TCE−, (E) TCE + R7050+, (F) TCE + R7050− mice. Magnification 400×. Scale bars = 50 μm. Representative DAB staining pattern from each group are shown.
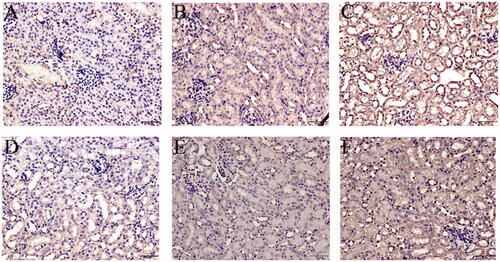
Figure 11. TNFα and TNFR1 expression in TCE-sensitized mice RTEC. (A) Representative immunoblot for expression of TNFα, TNFR1, and GAPDH in mouse kidney. (B) Relative expressions of TNFα and (C) TNFR1 normalized to GAPDH. All data shown are means ± SD. Levels of significance *p < 0.05.
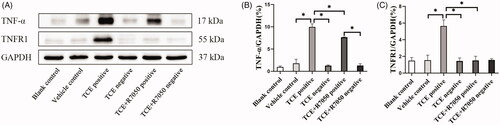
Figure 12. TNFα inhibition ameliorated renal tubule damage in TCE-sensitized mice. (A,B) Histopathological structure of renal tubules in TCE + R7050+ and TCE+ mice (magnification 400×). Scale bars = 50 μm. (C) Renal tubule function, assessed via serum β2-MG, in mice. All data are shown as means ± SD. Levels of significance *p < 0.05.
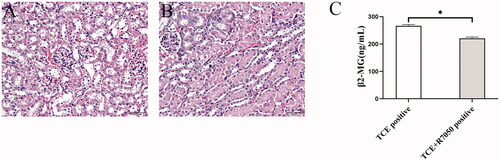
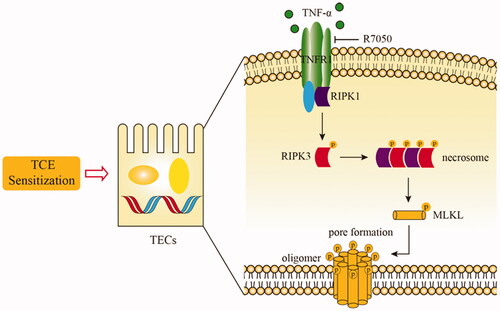
Figure 13. Schematic model of possible molecular mechanisms of TNFα/TNFR1 mediated- necroptosis during TCE sensitization.