
Figures & data
Table 1. Specific circRNA primers used for RT-qPCR analysis.
Figure 1. Screening of differentially-expressed circRNA in plasma samples from 22 patients with SLE and 22 HC subjects. Expression levels of (A) hsa_circ_0000175 [Student’s t-test], (B) hsa_circ_0044235 [Mann–Whitney U-test], and (C) hsa_circ_0068367 [Mann–Whitney] were significantly down-regulated in patients with SLE (compared with those noted in HC subjects). (D) Expression levels of hsa_circ_0002316 exhibited no significant differences between patients with SLE and HC subjects (Mann–Whitney). (E) Expression levels of hsa_circ_0104871 exhibited no significant differences between patients with SLE and HC subjects (Mann–Whitney test). (F) Expression levels of hsa_circ_0001947 were significantly down-regulated in patients with SLE compared with those noted in HC subjects (Mann–Whitney). (G) No differences in hsa_circ_0001481 expression levels between SLE and HC subjects (Student’s t-test). circRNA/circ = circular RNA. HC = healthy control. SLE = systemic lupus erythematosus.
![Figure 1. Screening of differentially-expressed circRNA in plasma samples from 22 patients with SLE and 22 HC subjects. Expression levels of (A) hsa_circ_0000175 [Student’s t-test], (B) hsa_circ_0044235 [Mann–Whitney U-test], and (C) hsa_circ_0068367 [Mann–Whitney] were significantly down-regulated in patients with SLE (compared with those noted in HC subjects). (D) Expression levels of hsa_circ_0002316 exhibited no significant differences between patients with SLE and HC subjects (Mann–Whitney). (E) Expression levels of hsa_circ_0104871 exhibited no significant differences between patients with SLE and HC subjects (Mann–Whitney test). (F) Expression levels of hsa_circ_0001947 were significantly down-regulated in patients with SLE compared with those noted in HC subjects (Mann–Whitney). (G) No differences in hsa_circ_0001481 expression levels between SLE and HC subjects (Student’s t-test). circRNA/circ = circular RNA. HC = healthy control. SLE = systemic lupus erythematosus.](/cms/asset/2f058e7e-21be-416b-a368-b5c966c7201a/iimt_a_2196453_f0001_b.jpg)
Table 2. Clinical parameters in the patients in this study.
Figure 2. Validation of expression levels of hsa_circ_0000175, hsa_circ_0044235, hsa_circ_0068367 and hsa_circ_0001947 in plasma samples during the second stage. (A) In plasma samples from 65 patients with SLE. expression levels of (A) hsa_circ_0000175 [Student’s t-test], (B) hsa_circ_0044235 [Mann–Whitney U-test], (C) hsa_circ_0068367 [Mann–Whitney], and (D) hsa_circ_0001947 [Student’s t-test] were significantly down-regulated compared with those in samples from 51 HC subjects. In plasma samples from 65 patients with SLE, expression levels of (E) hsa_circ_0000175 [Mann–Whitney], (F) hsa_circ_0044235 [Mann–Whitney], (G) hsa_circ_0068367 [Mann–Whitney], and (H) hsa_circ_0001947 [Mann–Whitney] in plasma samples from 65 patients with SLE were significantly down-regulated compared with those in samples from 51 patients with RA. SLE = systemic lupus erythematosus. HC = healthy control. RA = rheumatoid arthritis. circ = circular RNA.
![Figure 2. Validation of expression levels of hsa_circ_0000175, hsa_circ_0044235, hsa_circ_0068367 and hsa_circ_0001947 in plasma samples during the second stage. (A) In plasma samples from 65 patients with SLE. expression levels of (A) hsa_circ_0000175 [Student’s t-test], (B) hsa_circ_0044235 [Mann–Whitney U-test], (C) hsa_circ_0068367 [Mann–Whitney], and (D) hsa_circ_0001947 [Student’s t-test] were significantly down-regulated compared with those in samples from 51 HC subjects. In plasma samples from 65 patients with SLE, expression levels of (E) hsa_circ_0000175 [Mann–Whitney], (F) hsa_circ_0044235 [Mann–Whitney], (G) hsa_circ_0068367 [Mann–Whitney], and (H) hsa_circ_0001947 [Mann–Whitney] in plasma samples from 65 patients with SLE were significantly down-regulated compared with those in samples from 51 patients with RA. SLE = systemic lupus erythematosus. HC = healthy control. RA = rheumatoid arthritis. circ = circular RNA.](/cms/asset/f1ca3d84-de31-4b0a-b7e5-20d6ea948e53/iimt_a_2196453_f0002_b.jpg)
Table 3. Expression of plasma hsa_circ_0000175, hsa_circ_0044235, hsa_circ_0068367 and hsa_circ_0001947 in the equation.
Figure 3. ROC curve analysis of plasma hsa_circ_0044235 and hsa_circ_0001947 expression levels in patients with SLE and HC. (A) ROC curve analyses of plasma (A) hsa_circ_0044235 and (B) hsa_circ_0001947 expression levels in SLE patients and HC subjects. (C) ROC curve analysis using combined plasma hsa_circ_0044235, and hsa_circ_0001947 expression levels in SLE patients and HC subjects. ROC = receiver operating characteristics. SLE = systemic lupus erythematosus. HC = healthy control. circ = circular RNA.
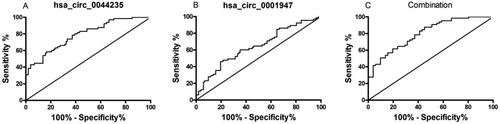
Table 4. ROC curve analysis of circRNA as SLE diagnosis from hosts in the RA and RA + HC groups.
Figure 4. ROC curve analysis of plasma hsa_circ_0044235 and hsa_circ_0001947 expression levels in patients with SLE and RA, RA + HC. ROC curve analysis of plasma (A) hsa_circ_0001947 and (B) hsa_circ_0044235 expression levels in patients with SLE and RA. (C) ROC curve analysis of combined plasma hsa_circ_0044235 and hsa_circ_0001947 expression levels in patients with SLE and RA. ROC curve analysis of plasma (D) hsa_circ_0001947 and (E) hsa_circ_0044235 expression levels in SLE and control subjects (patients with RA + HC subjects). (F) ROC curve analysis of combined plasma hsa_circ_0044235 and hsa_circ_0001947 expression levels in SLE and control subjects (patients with RA + HC subjects). ROC : receiver operating characteristics; SLE : systemic lupus erythematosus; RA : rheumatoid arthritis; HC : healthy control; circ : circular RNA.
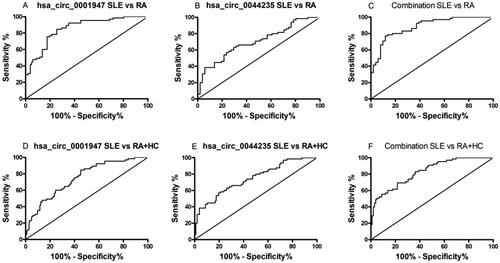
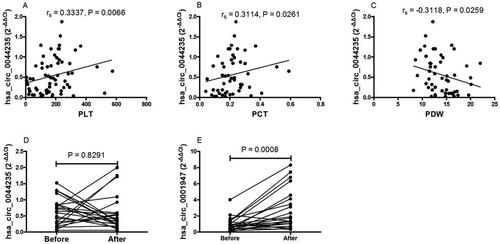
Figure 5. Correlation of plasma hsa_circ_0044235 and hsa_circ_0001947 expression levels with clinical manifestations of SLE. (A) Plasma expression levels of hsa_circ_0044235 in patients with SLE were positively associated with PLT (Spearman’s method). (B) Plasma expression levels of hsa_circ_0044235 in patients with SLE were positively associated with PCT (Spearman’s method). (C) Plasma expression levels of hsa_circ_0044235 in patients with SLE were negatively associated with PDW (Spearman’s method). (D) No significant difference was noted in the plasma expression levels of hsa_circ_0044235 prior to and following treatment (Student’s t-test, paired t-test). (E) Plasma expression levels of hsa_circ_0001947 were increased in these patients with SLE following treatment (Mann-Whitney test, Wilcoxon matched-pairs test). SLE : systemic lupus erythematosus; PCT : platelet crit; PDW : platelet distribution width; PLT : platelet count.
Supplemental Material
Download MS Word (59.6 KB)Data availability statement
The data used to support the findings of the present study are available from the corresponding author on reasonable request.