Figures & data
Table 1. Primer sequences used in the study.
Table 2. Clinical data from patients in the control and PE groups.
Figure 1. Circulating Treg and TH17 cell levels in human subjects. (A and B) Treg and TH17 cells in blood (flow cytometry). (C and D) detection of Treg cells in placental tissues (immunohistochemical staining). (E and F) Foxp3 and RORc mRNA and protein expression (RT-qPCR and Western blot analyses). **p < 0.01 vs. control group. Control group, n = 23; PE group, n = 18.
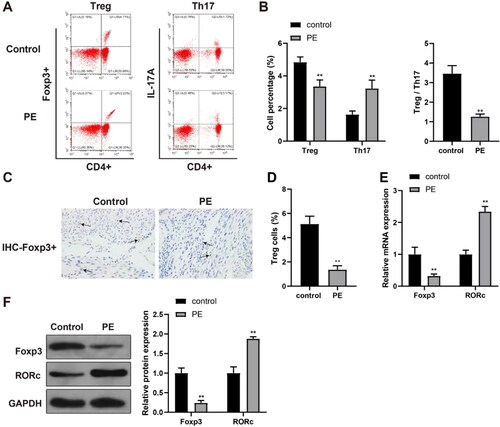
Figure 2. Inflammation response indices in the blood. (A-C) ELISA was used to measure select inflammatory cytokines in the peripheral blood. *p < 0.05, **p < 0.01 vs. control group. Control group, n = 23; PE group, n = 18.
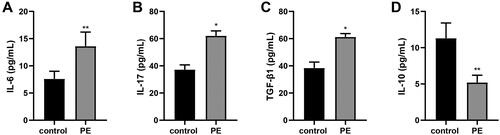
Figure 3. Cell apoptosis in placental tissues. TUNEL staining was used to assess levels of cell apoptosis in all harvested human placental tissues. **p < 0.01 vs. control group. Control group, n = 23; PE group, n = 18.
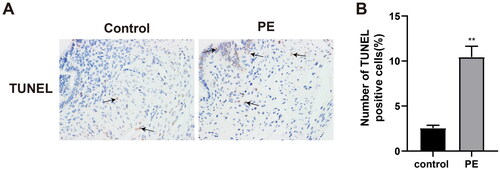
Figure 4. Changes in trophoblast infiltration and spiral artery. (A) Changes in trophoblast infiltration and spiral artery. Spiral arteries: (B) without physiological and pathological changes (H&E, 200× magnification); (C) with physiological expansion (H&E, 200× magnification); or, (D) with pathological changes (H&E, 200× magnification). physiologically-altered spiral arteries (E) with trophoblast infiltration (immunohistochemical staining, 400× magnification) or (F) without trophoblast infiltration (immunohistochemical staining, 400× magnification). trophoblasts appear brownish yellow.
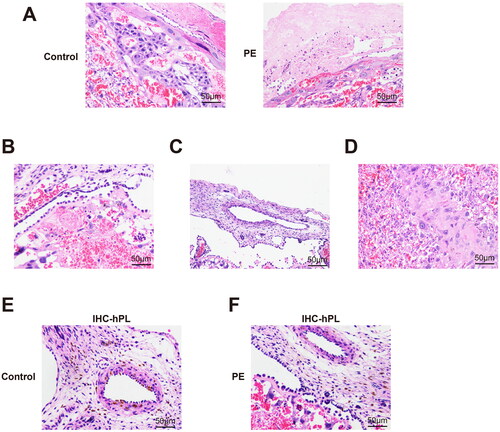
Table 3. Depth of trophoblast infiltrating membrana serotina and superficial myometrium of placenta bed.
Table 4. Density of trophoblast infiltrating membrana serotina and superficial myometrium of placenta bed.
Table 5. Lumen area and wall thickness of spiral artery in placental bed.
Figure 5. Over-expression of YY1 and the PE process. RT-qPCR and Western blot analysis were used to determine YY1 (A) mRNA and (B) protein expression in human placental samples. (C) Linear correlation analysis of the correlation between YY1 and Foxp3 expression in PE patient placental tissues. RT-qPCR and Western blot analyses were used to determine YY1 (D) mRNA and (E) protein expression in rat placental tissues. (F) Blood pressure in rats. (G) Rat urinary protein content. (H-J) Blood inflammatory cytokines (ELISA). N = 6/group. *p < 0.05, ** p < 0.01 vs. sham group; #p < 0.05 vs. control group.
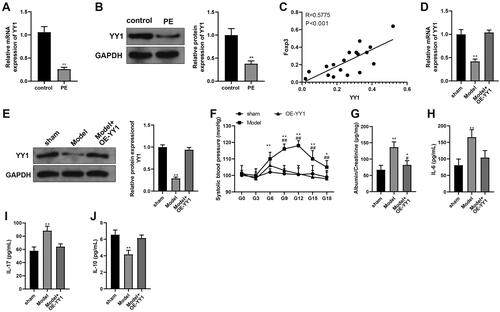
Table 6. Pregnancy-related indicators in rat hosts.
Figure 6. Over-expression of YY1 inhibits the PE process. Levels of (A) TH17 and (B) Treg cells (flow cytometry). Foxp3 and RORc (C) mRNA and (D) protein expression (RT-qPCR and Western blot analyses). *p < 0.05, **p < 0.01 vs. sham or control group. N = 6/group.
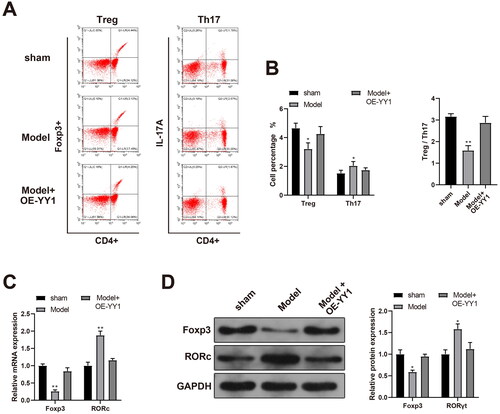
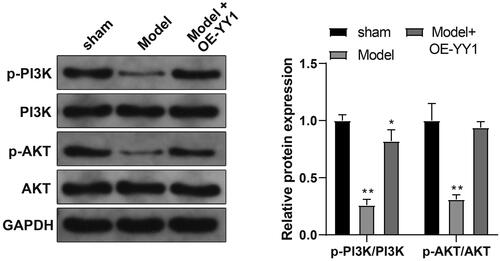
Figure 7. YY1 activates the PI3K/AKT pathway. Expression of PI3K/AKT pathway-related proteins in placental tissues (Western blot). *p < 0.05, **p < 0.01 vs. sham group. N = 6/group.