
Figures & data
Table 1. Primer sequences used for the qRT-PCR assays here.
Figure 1. PM exposure and ER stress in HBE cells. HBE cells were treated with 100 µg PM/ml for various lengths of time or with various concentrations of PM for 6 hr. Expression of GRP78 and IRE1α were then evaluated using Western blot analysis (A–D). Relative expression of GRP78 and IRE1α after normalization to lysate β-actin levels. *p < 0.05; **p < 0.01.
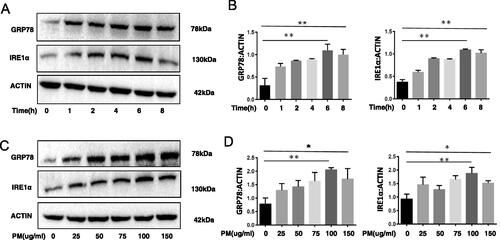
Figure 2. Inhibition of ER stress impact on PM-induced inflammation-related responses in HBE cells. HBE cells were transfected with indicated siRNA for 24 hr, and then treated with 100 µg PM/ml for additional 8 hr. Relative levels of IL-6 (A and E) and IL-8 (B and F) mRNA were then evaluated (qRT-PCR). IL-6 (C and G) and IL-8 (D and H) protein levels were measured in culture supernatants (ELISA). *p < 0.05; **p < 0.01.
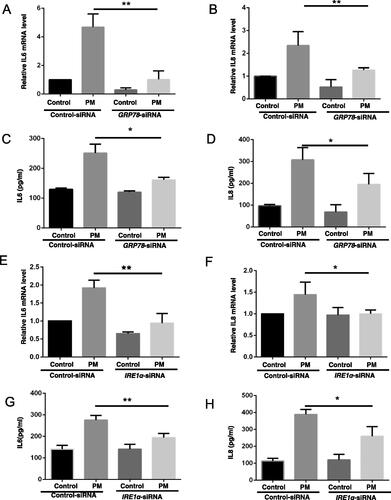
Figure 3. ER stress inhibitor 4-PBA impact on PM-induced airway inflammation-related outcomes in HBE cells. After treatment with various concentrations of 4-PBA for 1 hr, HBE cells were exposed to 100 µg PM/ml for an additional 6 hr, expression of GRP78 and IRE1α were then evaluated by Western blot analysis (A and B). After the HBE cells were treated with 4-PBA (2 mM), PM + 4-PBA (2 mM), or vehicle for 8 hr, IL-6 (C) and IL-8 (D) mRNA expressions were measured (qRT-PCR).
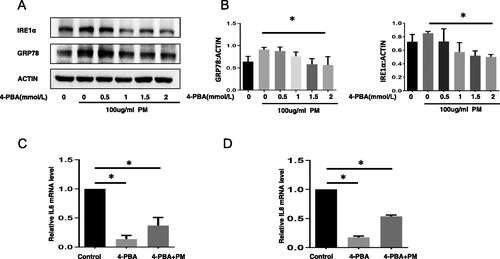
Figure 4. ER stress regulation of PM-induced inflammation-related responses in HBE cells via autophagy. Control-siRNA or LC3B-siRNA-transfected HBE cells were treated with or without 100 µg PM/mL for 8 hr, and then IL-6 (A) and IL-8 (B) mRNA levels were evaluated (qRT-PCR). Control-siRNA or GRP78-siRNA or IRE1α-siRNA-transfected HBE cells were treated with or without 100 µg PM/ml for 2 hr, and then protein levels of LC3B in the cells were evaluated using Western blot analysis (C and D). *p < 0.05; **p < 0.01.
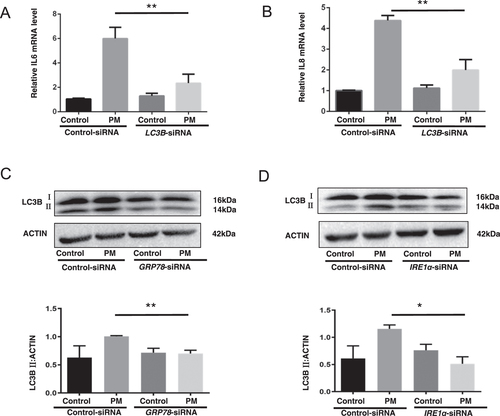
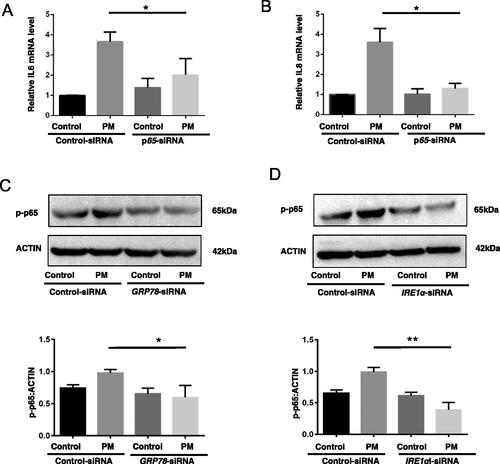
Figure 5. ER stress as regulator of PM-induced inflammation-related events in HBE cells through NF-κB pathway activation. Control-siRNA or p65-siRNA-transfected HBE cells were treated with or without 100 µg PM/ml for 8 hr and then IL-6 (A) and IL-8 (B) mRNA expression was measured (qRT-PCR). Control-siRNA or GRP78-siRNA or IRE1α-siRNA-transfected HBE cells were treated with or without 100 µg PM/mL for 2 hr and then expression of p-p65 was evaluated by Western blotting (C and D). Blots representative of three independent experiments. *p < 0.05; **p < 0.01.
Supplemental Material
Download MS Power Point (92.1 KB)Data availability statement
Access to the data generated during this study can be obtained by reasonable request to the corresponding author.