Figures & data
Table 1. Sequences of the primers used in the RT-PCR.
Table 2. Antibody information.
Figure 1. VD impact on renal status of DDP-induced AKI mouse model. (A) Renal macroscopic morphology. (B) Ratio of kidney weight to body weight. (C) Body weight changes. (D) H&E staining (40×). (E) Masson staining (40×). (F) Histologic analysis of PAS-stained sections (20×). in D-E, bars = 50 μm. (G) sCr assay. (H) BUN assay. (I) MDA levels. Values shown are means ± SD. *p < 0.05, **p < 0.01, ****p < 0.0001. DDP, cisplatin; H&E, hematoxylin and eosin; PAS, periodic acid-Schiff; sCr, serum creatinine; BUN, blood urea nitrogen; MDA, malondialdehyde.
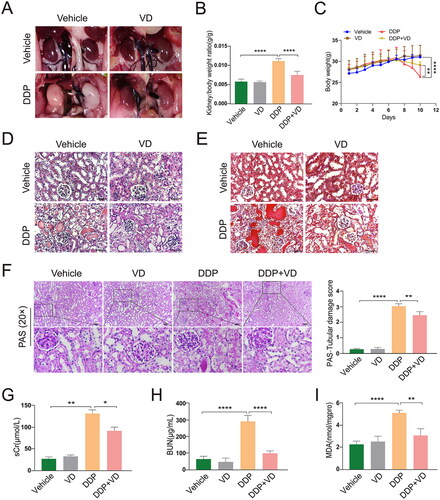
Figure 2. VD effect on pro-inflammatory cytokine levels in DDP-induced AKI mouse model. Relative mRNA expression of (A) TNFα, (B) IL-1β, and (C) IL-18 (RT-PCR). (D) Protein expression of TNFα, IL-1β, and IL-18 (Western blot); GAPDH protein levels used as loading control. (E) IL-1β expression (IHC). Bars = 50 μm. (F) Expression of MPO (IHC) and F4/80 (IF). Bars = 50 μm. Values shown are means ± SD. *p < 0.05, **p < 0.01, ***p < 0.001, ****p < 0.0001. DDP, cisplatin; AKI, acute kidney injury; GAPDH, glyceraldehyde-3-phosphate dehydrogenase; IHC, immunohistochemistry; IF, immunofluorescence; MPO, myeloperoxidase; F4/80, mouse EGF-like module-containing mucin-like hormone receptor-like 1.
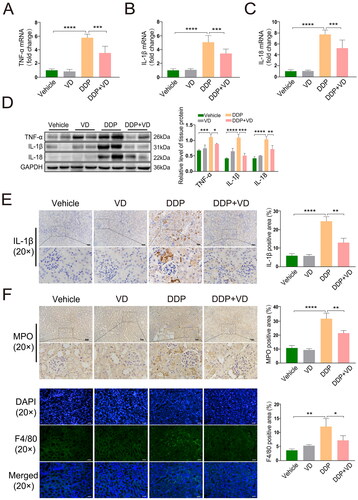
Figure 3. VD impact on injury marker levels in DDP-treated HK-2 cells. (A) Cytotoxicity (MTT assay). (B) Lipid peroxidation (MDA content). relative mRNA expressions of pro-inflammatory (C) TNFα, (D) IL-1β, and (E) IL-18 (RT-PCR). (F) Protein levels of TNFα, IL-1β, and IL-18 (Western blot); GAPDH protein levels used as loading control. Values shown are means ± SD. *p < 0.05, **p < 0.01, ***p < 0.001, ****p < 0.0001. DDP, cisplatin; MDA, malondialdehyde; GAPDH, glyceraldehyde-3-phosphate dehydrogenase.
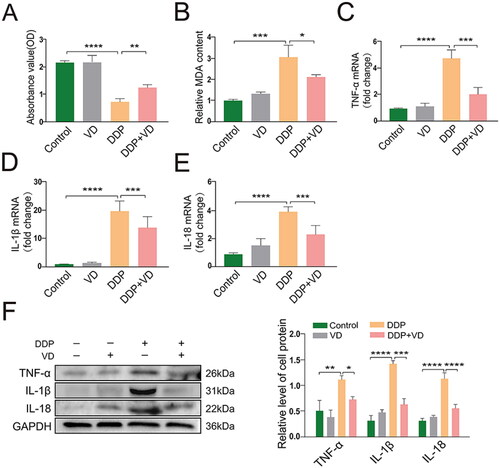
Figure 4. VD/VDR impact on C5aR expression in AKI in vivo and in vitro. Relative mRNA expression of (A) VDR and (B) C5aR in mice (RT-PCR). (C) Protein expression of VDR and C5aR in mice (Western blot); GAPDH protein levels used as a loading control. Relative mRNA expression of (D) VDR and (E) C5aR in HK-2 cells (RT-PCR). (F) HK-2 cell protein expression of VDR and C5aR (Western blot); GAPDH protein levels used as loading control. (G) C5aR expression and distribution (IHC). Bars = 50 μm. Values shown are means ± SD. *p < 0.05, **p < 0.01, ***p < 0.001, ****p < 0.0001. VDR, Vitamin D receptor; C5aR, C5a anaphylatoxin chemotactic receptor; DDP, cisplatin; GAPDH, glyceraldehyde-3-phosphate dehydrogenase; IHC, immunohistochemistry.
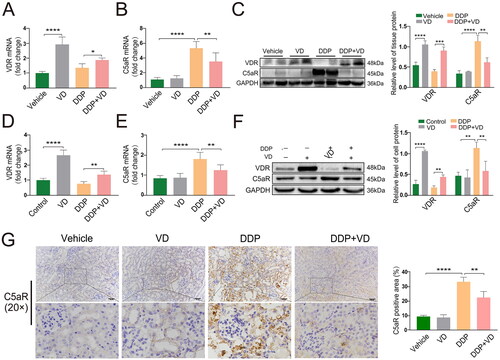
Figure 5. Cytoprotective effect of VD/VDR in DDP-induced cells with C5aR over-expression. C5aR over-expression was validated using (A) RT-PCR and (B) Western blot. (C) MTT assay. (D) MDA levels. (E) Protein expression of VDR, C5aR, TNFα, IL-1β, and IL-18 (Western blot); GAPDH levels used as a loading control. Values shown are means ± SD. *p < 0.05, **p < 0.01, ***p < 0.001, ****p < 0.0001, n.s., not significant. VDR, Vitamin D receptor; DDP, cisplatin; C5aR, C5a anaphylatoxin chemotactic receptor; MDA, malondialdehyde; GAPDH, glyceraldehyde-3-phosphate dehydrogenase. Vector, empty pcDNA3.1 vector; C5aR+/+, pcDNA3.1-C5aR plasmid.
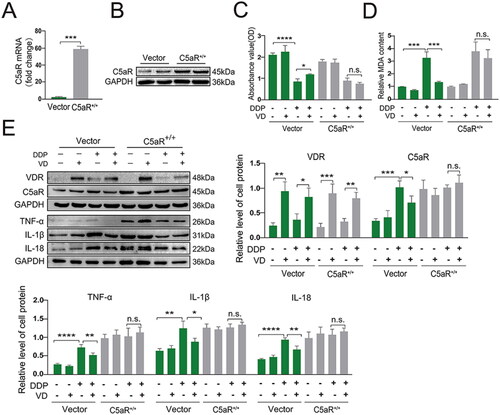
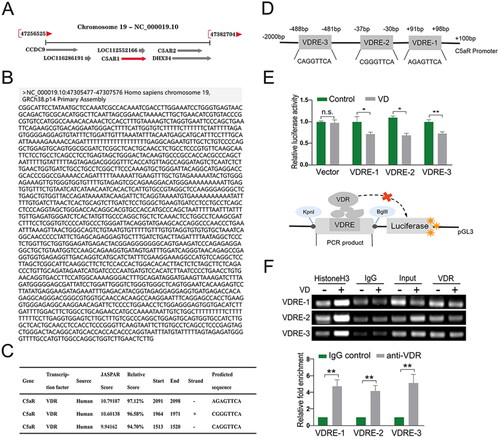
Figure 6. VD/VDR targets VDRE sites in C5aR promoter region. (A) Location and transcription direction of C5aR in the human genome. (B) Calculated C5aR promoter region. (C) Three VDRE sites with the highest relative score. (D) Location of VDRE in C5aR promoter region. (E) Relative luciferase activity by Luciferase reporter gene assay; schematic diagram. (F) Binding between VDR and C5aR promoter as confirmed by ChIP-PCR. Values shown are means ± SD. *p < 0.05, **p < 0.01, n.s., not significant. VDR, Vitamin D receptor; VDRE, Vitamin D reaction element; C5aR, C5a anaphylatoxin chemotactic receptor; ChIP, Chromatin Immunoprecipitation. Vector, empty pGL3-basic vector; VDRE-1/2/3, three predicted VDRE sites on C5aR promoter.