
Figures & data
Table 1. Source materials purchased from Stallergenes Greer Ltd. (Lenoir, NC), and used for proteomic and bioinformatic analyses.
Figure 1. Overview of proteomic and bioinformatic results for 12 source materials. Shown are the number (A) and sum of the relative abundances* (B) of all identified and semi-quantified protein sequences (n = 4,586) with AllerCatPro 2.0 predictions for strong, weak and no evidence for allergenicity. *total mass related to the total protein content of the material.
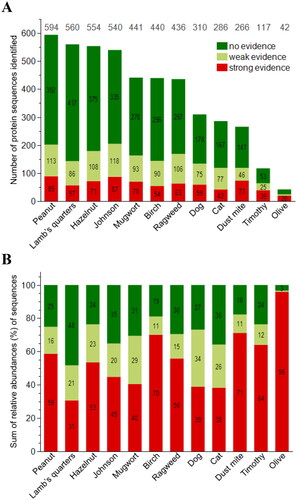
Figure 2. Relative abundance [%] of top 25 proteins identified and semi-quantified in 12 materials by proteomic analysis, their predicted ‘best hit protein name’ and prediction for strong, weak or no evidence for allergenicity using AllerCatPro 2.0.
![Figure 2. Relative abundance [%] of top 25 proteins identified and semi-quantified in 12 materials by proteomic analysis, their predicted ‘best hit protein name’ and prediction for strong, weak or no evidence for allergenicity using AllerCatPro 2.0.](/cms/asset/aae91abf-951d-42da-bd38-d0de0ef8f0e1/iimt_a_2305452_f0002_c.jpg)
Table 2. Identified species-specific allergens (n = 129) in 12 analyzed source materials, their relative abundance, and predicted evidence for allergenicity using AllerCatPro 2.0.