Figures & data
Figure 1. Lung-delivered IL-10 therapy reduces weight loss, serum pentraxin-2 levels, and airway inflammatory cell influx following a one-time ODE exposure. (A) Experimental design schematic (created with BioRender.com). (B) Line graphs depict mean (± SEM) weight changes over time with ODE (12.5, 25, 50% concentration)-exposed mice treated with IL-10 vs. vehicle (Veh) vs. control (Cxn, saline treated mice, no ODE). (C) Scatter-dot plots depict mean with SEM bars among treatment groups of serum pentraxin-2 levels. (D) Total cellular influx and leukocyte cell numbers quantitated in bronchoalveolar lavage fluid (BALF). N = 4 (Cxn) and N = 5–9 (Veh, IL-10) mice/group. Statistical significance vs. Cxn (#p < 0.05, ##p < 0.01, ###p < 0.001, ####p < 0.0001); between groups (*p < 0.05, **p < 0.01, ***p < 0.001).
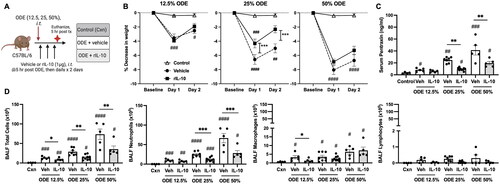
Figure 2. Lung-delivered IL-10 therapy reduces inflammatory cytokines/chemokines following a one-time ODE exposure. Levels of airway inflammatory markers determined by ELISA from (A) BALF and (B) lung homogenates. N = 4 (Cxn) and N = 5–9 (Veh, IL-10) mice/group. Statistical significance vs. Cxn (#p < 0.05, ##p < 0.01, ####p < 0.0001); between groups (*p < 0.05, ***p < 0.001, ****p < 0.0001).
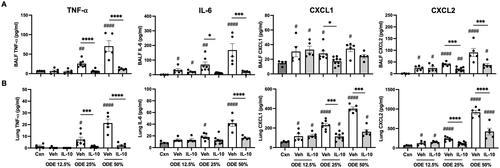
Figure 3. Lung-delivered IL-10 therapy following a one-time ODE exposure modulates total lung and myeloid cell infiltrates. (A) Scatter-dot plots depict mean (± SEM) total lung cells across treatment groups of control, ODE + vehicle, and ODE + IL-10 treatment. (B) Representative gate images for lung neutrophils in treatment groups after exclusion of debris, doublets, dead cells, and CD45- cells (with numbers of lung neutrophils [PMN; mean ± SEM] depicted in scatter-dot plots [C]). (D) Representative gate images for lung macrophage/monocyte Sub-populations in treatment groups: Alveolar macrophages (Alv MΦ) CD11c+CD11blo; Activated macrophages (Act MΦ) CD11c+CD11b+; Transitioning monocyte/macrophages (Mono-MΦ) CD11cintCD11b+; Monocytes (Mono) CD11c-CD11b+ after exclusion of debris, doublets, dead cells, CD45- cells, and neutrophils [numbers of Sub-populations depicted by scatter-dot plots] (E). Cell numbers determined by multiplying percentage of population from live CD45+ cells by total lung cells enumerated. N = 4 (Cxn) and N = 5–9 (vehicle, IL-10) mice/group. Statistical significance vs. Cxn (#p < 0.05, ##p < 0.01, ###p < 0.001, ####p < 0.0001); between groups (*p < 0.05, **p < 0.01, ****p < 0.0001).
![Figure 3. Lung-delivered IL-10 therapy following a one-time ODE exposure modulates total lung and myeloid cell infiltrates. (A) Scatter-dot plots depict mean (± SEM) total lung cells across treatment groups of control, ODE + vehicle, and ODE + IL-10 treatment. (B) Representative gate images for lung neutrophils in treatment groups after exclusion of debris, doublets, dead cells, and CD45- cells (with numbers of lung neutrophils [PMN; mean ± SEM] depicted in scatter-dot plots [C]). (D) Representative gate images for lung macrophage/monocyte Sub-populations in treatment groups: Alveolar macrophages (Alv MΦ) CD11c+CD11blo; Activated macrophages (Act MΦ) CD11c+CD11b+; Transitioning monocyte/macrophages (Mono-MΦ) CD11cintCD11b+; Monocytes (Mono) CD11c-CD11b+ after exclusion of debris, doublets, dead cells, CD45- cells, and neutrophils [numbers of Sub-populations depicted by scatter-dot plots] (E). Cell numbers determined by multiplying percentage of population from live CD45+ cells by total lung cells enumerated. N = 4 (Cxn) and N = 5–9 (vehicle, IL-10) mice/group. Statistical significance vs. Cxn (#p < 0.05, ##p < 0.01, ###p < 0.001, ####p < 0.0001); between groups (*p < 0.05, **p < 0.01, ****p < 0.0001).](/cms/asset/f7f5676a-bfc4-4444-8841-2f60d67c0d68/iimt_a_2332172_f0003_c.jpg)
Figure 4. Lung-delivered IL-10 treatment following one-time 25% ODE exposure modulates immune phenotype of activated monocyte/macrophage Sub-populations. (A) Scatter-dot plots depict mean (± SEM bars) percent cell surface marker and intracellular cytokine (IL-10, TNFα) expression in monocyte/macrophage Sub-populations. N = 10 mice/group from two experimental runs. (B) Cell surface marker and intracellular cytokine percent expression of monocyte/macrophage Sub-populations exposed to ODE followed by treatment with vehicle (Veh) or IL-10. N = 5 mice/group from single experimental run. Statistical significance vs. Cxn (####p < 0.0001); between groups (*p < 0.05, **p < 0.01, ****p < 0.0001).
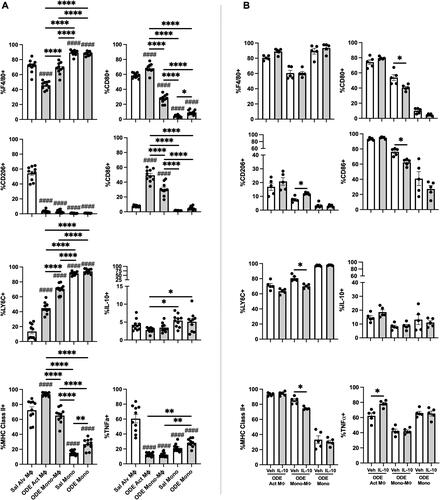
Figure 5. ODE exposure induces functional changes in lung monocyte/macrophage Sub-population phagocytic ability and reactive oxygen species (ROS) production. (A) Represent-ative histograms depicting phagocytosed fluorescein-labeled E. coli BioParticles of saline (Sal) vs. ODE exposed monocyte-macrophage Sub-populations. Scatter-dot plots depict mean (± SEM) percent of cell Sub-population exhibiting BioParticle-specific fluorescence and the phagocytic index (mean fluorescence intensity (MFI) of positive BioParticle gate per Sub-population divided by MFI of Sal Alv MΦ positive BioParticle gate). (B) Representative histograms depicting ROS production determination by CellROX Deep Red fluorescence; scatter-dot plots depict percent of cell Sub-populations exhibiting CellROX Deep Red fluorescence and ROS index (MFI of positive CellROX gate per Sub-population divided by MFI of Sal Alv MΦ positive CellROX gate). N = 10 mice/group from two independent experiments. Statistical significance vs. Sal Alv MΦ denoted by ##p < 0.01, ###p < 0.001, ####p < 0.0001); between groups (*p < 0.05, **p < 0.01, ****p < 0.0001).
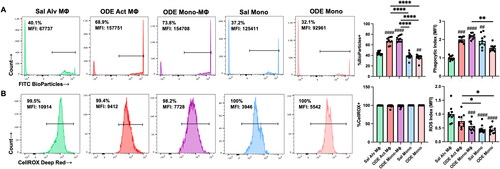
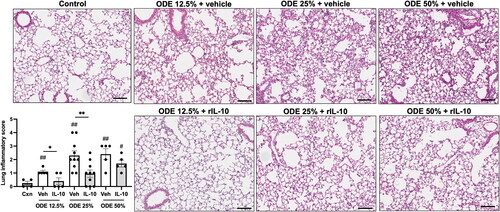
Figure 6. Treatment with IL-10 reduces ODE-induced lung inflammation. Representative H&E-stained lung section images from all treatment groups (ODE at various concentrations with IL-10 or saline vehicle treatment) and saline control. Scatter-dot plot depicts mean (± SEM) bars of semi-quantitative lung inflammatory scores per experimental treatment group. Individual values are averaged from 8 to 10 images/section/mouse. Statistical significance vs. Cxn (#p < 0.05, ##p < 0.01); between groups (*p < 0.05, **p < 0.01). Line scale is 100 μm.