
Figures & data
Figure 1. The framework of the study.
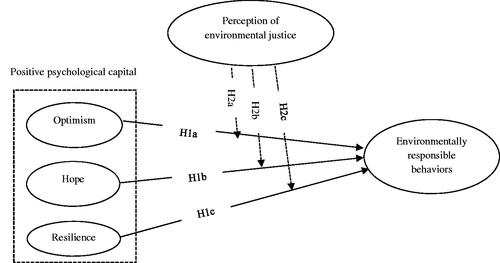
Table 1. Means, standard deviations, and Pearson correlation coefficients.
Table 2. Hierarchical Regression analyses: dependent variable in all models is employees’ environmentally responsible behavior or sustainable behavior.
Figure 2. Interaction effect of employees’ hope and environmental justice perception or judgments on their sustainable behaviors.
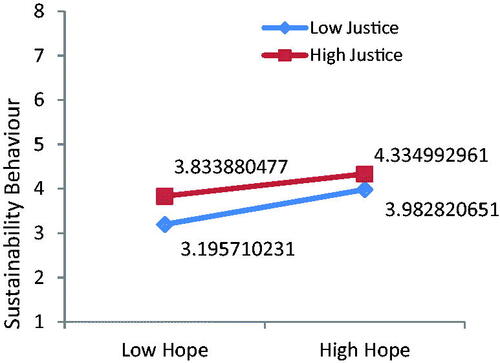
Figure 3. Interaction effect of employees’ resilience and environmental justice perception or judgments on their sustainable behaviors.
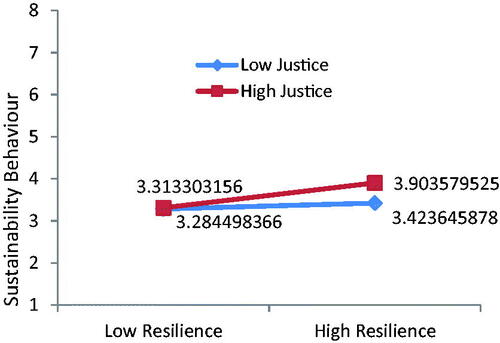
Table 3. Results of hierarchical moderated regression analyses (dependent variable: employees’ environmentally responsible behavior or sustainable behavior).