
Figures & data
Figure 1. Globalization and CO2 emissions in Ghana, 1971–2016. Source: Authors’ calculations based on CO2 discharge and globalization index from the World Bank’s World Development Indicators and KOF Swiss Economic Institute.
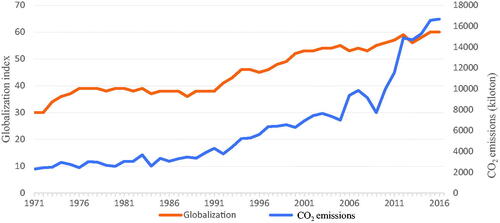
Figure 2. Multilayer-feed-forward system of 4 inputs. Source: Adopted from As’ad, Sujito, and Setyowibowo (Citation2020).
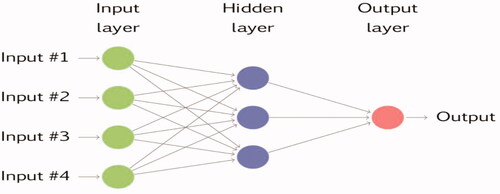
Table 1. Summary statistics.
Table 2. ADF and P − P stationarity test results.
Table 3. Markov-switching models results.
Figure 3. Smoothed probablity for MS1 Model.
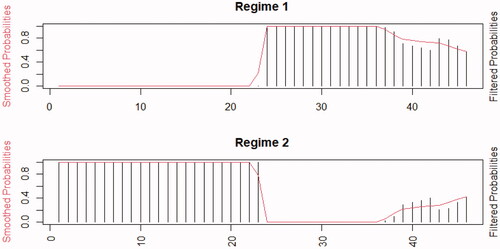
Figure 4. Smoothed probability for MS2 Model.
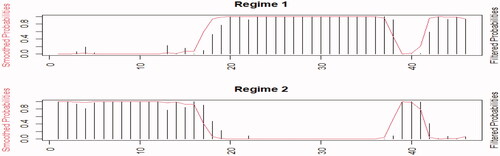
Table 4. Transition probabilities and model specification test results.
Figure 5. Smoothed probability for MS3 Model.
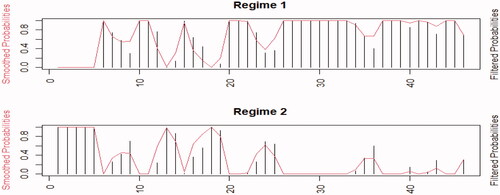
Figure 6. Q–Q, ACF, and PACF plots from MS1 Model.
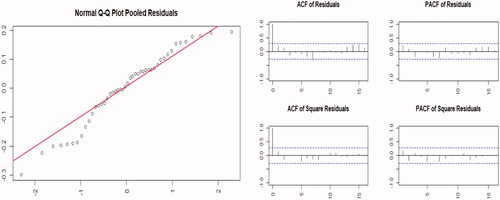
Figure 7. Q–Q, ACF, and PACF plots from MS2 Model.
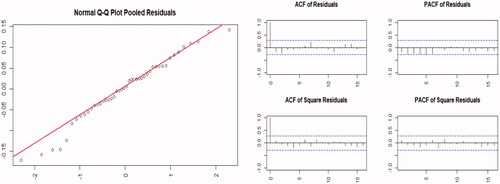
Figure 8. Q–Q, ACF, and PACF plots from MS3 Model.
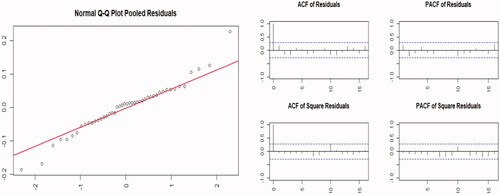
Figure 9. Series plot, ACF, and PACF of emisions in Ghana.
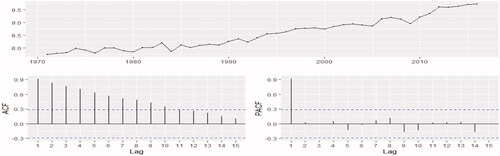
Table 5. Measures of accuracy of the NNAR(p, k) trainning models.
Figure 10. NNAR(14, 8) prediction (Annual growth in Ghana, 2011–2030).
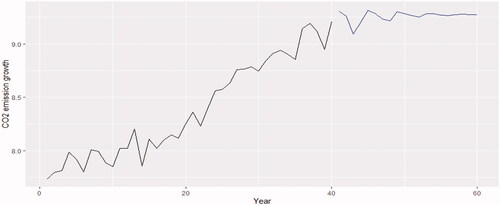
Table 6. Predicted values of the NNAR(14, 8) model.
Figure 11. Predicted NNAR(14, 8) values.
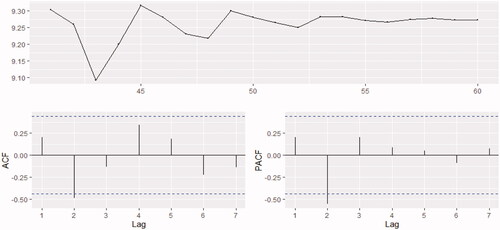
Figure A1. Time-series plots of the variables used in the study (level and first difference).
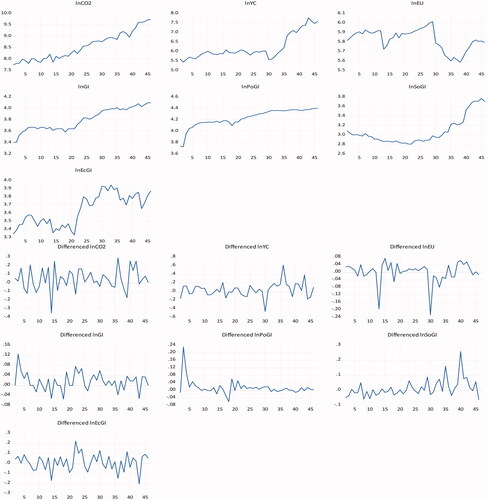
Table A1. Zivot-Andrews (ZA) stationarity test results.