
Figures & data
Figure 1. Main phases of the CTL process, including an overview of methods and data collected.
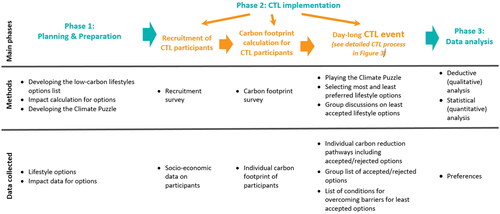
Figure 2. Steps of the CTL event.
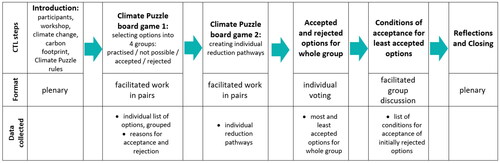
Figure 3. Average, highest, and lowest carbon-footprint data according to case county.
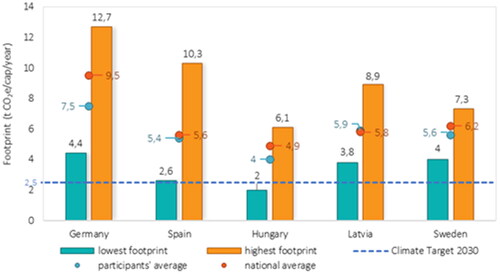
Figure 4. Mosaic plots illustrating frequencies of the acceptance of lifestyle options across (a) consumption domains, (b) main investment types, and (c) impact levels.
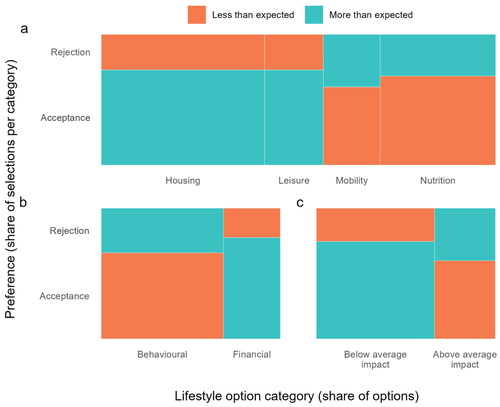
Table 1. Significance and strength of association between acceptance vs. rejection and different categorizations.
Table 2. The five lifestyle options with the highest (above 90%) acceptance rates (see Supplementary Material I, Section E for average acceptance rates for all options).
Table 3. The five lifestyle options with the lowest acceptance rates (see Supplementary Material I, Section E for average acceptance rates for all options).