
Figures & data
Fig. 1 CIE whiteness forumula illustrated in CIE 1964 10° chromaticity diagram [CIE Citation2004]. The black dot locates the chromaticity coordinates of the reference illuminant—CIE Illuminant D65. The main direction for CIE whiteness is along the dotted line connecting the chromaticity of the reference illuminant and the spectrum locus at a dominant wavelength at 470 nm. Shifts parallel to this direction with a small angle correspond to whiteness; shifts perpendicular to this direction correspond to tint [ISO Citation2004].
![Fig. 1 CIE whiteness forumula illustrated in CIE 1964 10° chromaticity diagram [CIE Citation2004]. The black dot locates the chromaticity coordinates of the reference illuminant—CIE Illuminant D65. The main direction for CIE whiteness is along the dotted line connecting the chromaticity of the reference illuminant and the spectrum locus at a dominant wavelength at 470 nm. Shifts parallel to this direction with a small angle correspond to whiteness; shifts perpendicular to this direction correspond to tint [ISO Citation2004].](/cms/asset/18b121a0-9f8e-4532-9a45-3a24c3488239/ulks_a_902750_f0001_b.gif)
Fig. 2 (a) Photograph of the side-by-side viewing booths, also showing the chin and forehead rests; (b) examples of high dynamic range (HDR) images taken by fish-eye lens showing the simliarity of the luminance distribution of the two booths: (left) under illumination by a same lamp type; (right) under illumination by two different lamp types.
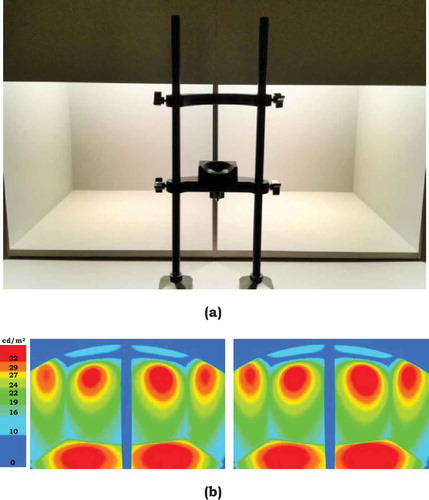
TABLE 1 Summary of spectral data for the five lamp types. Chromaticity values are averages of 51 measurements taken during the course of the sessions. All measurements for the filtered halogen (left and right) can be contained in a 0.6-step MacAdam ellipse. The other ellipse sizes are 1.1 (BLED), 1.0 (2.5% VLED), 0.7 (5% VLED), and 0.6 (6.5% VLED). CRI is averaged across the left and right rooms
Fig. 3 Relative SPDs of the five different lamp types included in the experiments, normalized to peak power. Measurements were taken from 380 to 780 nm in 4-nm increments with a PR-655 SpectraScan spectroradiomter (Photo Research Inc., Cary, NC, USA) aimed at a diffuse reflectance standard (SRT-MS-100, ρ = 99%) (Labsphere North America, North Sutton, NH, USA). The SPDs are averages of measurements taken in both booths.
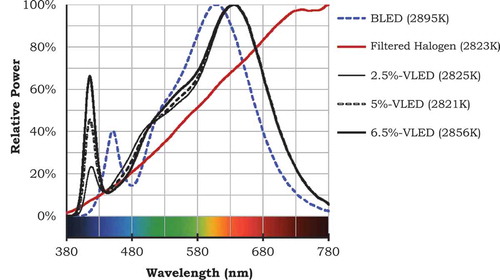
Fig. 4 Spectral emission of six whiteness standards containing different amounts of FWAs under a monochromatic illumination of 390 nm. The curves are scaled to the highest emission intensity among the six curves. The standards with greater amount of FWAs have higher values of whiteness, W. The whiteness standard labeled as W = 81.9, which exhibits almost no emission, does not contain FWAs.
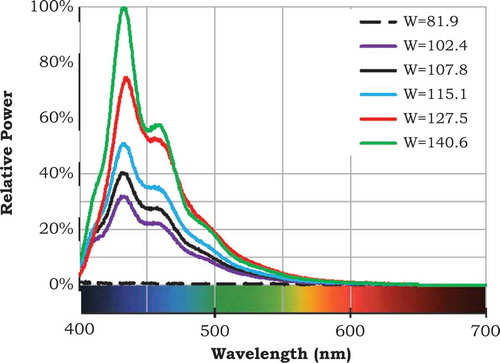
Fig. 5 Results of the average rank of each whiteness standard under each illumination with standard deviation bars. The ranks of each whiteness standard were signficantly different from each other under the filtered halogen, 2.5%-, 5%-, and 6.5%-VLEDs. Two pairs of standards under BLED were not significantly different; these pairs are shown with identical hachure lines in (a).
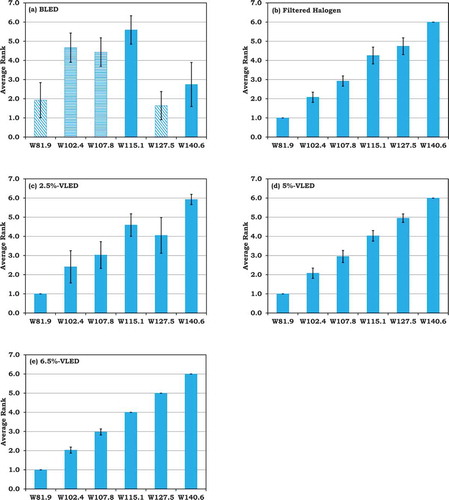
TABLE 2 Summary of the VSRS tests for the forced-choice sessions. Values in the matrix are the difference of Ri between lamp types. Shaded values represent comparisons that are significantly different at the α = 0.05 level (with a value larger than 31.10), all of which are also significantly different at the α = 0.01 level (with a value larger than 37.11). (a) Comparisons of whiteness standards without FWAs (W81.9 and W83.3) and (b) comparisons of whiteness standards with FWAs (W140.1 and W140.6)
Fig. 6 Results of the selection experiment, summarizing the percentage of the selection (vertical axis) for each whiteness standard (horizontal axis) under each of the test SPDs (different lines) that were perceived to have equal or higher whiteness than W115.5 under each of the reference SPDs (shown as the inset title of each figure). Percentages greater than 67% are significantly higher than 50%, indicating that those whiteness standard and illumination conditions were perceived to have equal or higher whiteness than the reference standard (W115.5) under the reference SPD. The error bars show the difference between counterbalanced conditions (that is, variation from when the reference standard was placed in the left or right booth).
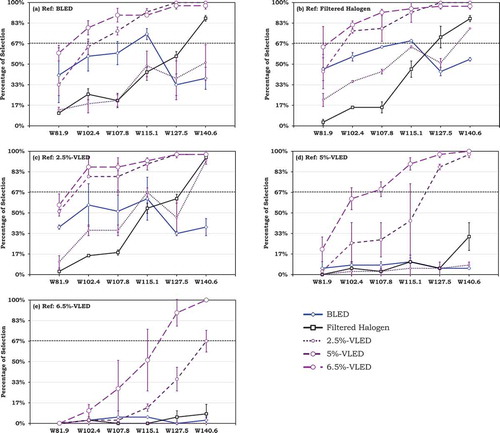
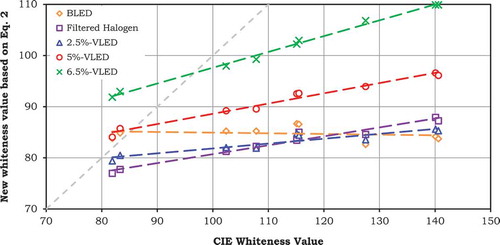
Fig. 7 New whiteness value of the standards under the illumination of the five lamps by adopting the whiteness formula proposed by David and his colleagues [2013] and employing the TC 1-36 10° CMFs. The dashed line shows the diagonal x = y. The standards under the filtered halogen and the three VLEDs show increased new whiteness values with CIE whiteness values; all of the standards have simliar whiteness values under BLED. The standards under 5%-VLED and filtered halogen have similar new whiteness values.
![Fig. 7 New whiteness value of the standards under the illumination of the five lamps by adopting the whiteness formula proposed by David and his colleagues [2013] and employing the TC 1-36 10° CMFs. The dashed line shows the diagonal x = y. The standards under the filtered halogen and the three VLEDs show increased new whiteness values with CIE whiteness values; all of the standards have simliar whiteness values under BLED. The standards under 5%-VLED and filtered halogen have similar new whiteness values.](/cms/asset/0252d050-5bc7-440a-aa4e-9991a533bee3/ulks_a_902750_f0007_oc.jpg)
Fig. 8 Chromaticity coordinates of all nine standards used in this study in the left booth using the TC 1-36 10° CMFs. The results are similar for the right booth (not shown). The dashed line corresponds to the BB-470-nm line. The solid trendlines show the shift of chromaticity of the whiteness standards under the filtered halogen and 2.5%-, 5%-, and 6.5%-VLEDs, which are consistent with the results of sorting experiment. The shaded grey region indicates tint values of ±3.
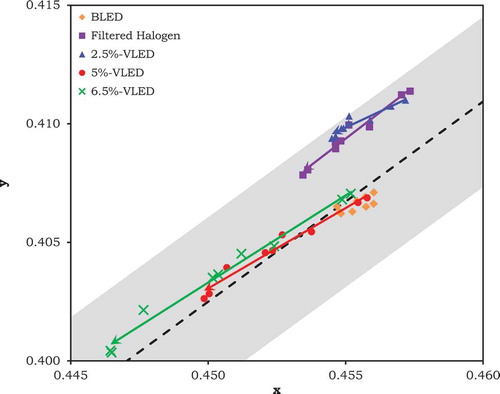
Fig. 9 Chromaticity shift of the whiteness standards in the CIE u′v′ diagram, employing the TC 1-36 10° CMFs. Points aligned on the same vertical are for standards with the same CIE whiteness values. The points in the dashed yellow oval illustrate the magnitude and range of the chromaticity shift from the source to the standards without FWAs (W81.9 and W83.3) under each illumination; the shifts are similar under all five lamps. The other points represent the magnitude of the chromaticity shift from the standards without FWAs to the standards with different amounts of FWAs when illuminated by each lamp type.
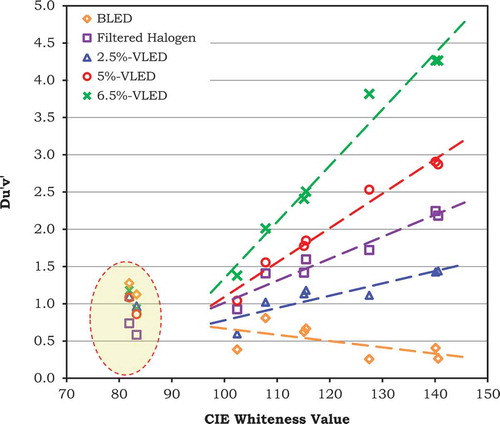
Fig. A1 Results of trials of null conditions included in the forced-choice task: (a) W81.9 versus W83.3 and (b) W140.1 versus W140.6. The trials having significant difference between left and right are labeled with an asterisk (*) at the horizontal axis. Though these were expected to be null-condition trials, participants were able to discern differences due to differences in the whiteness standards and lamps of the same type, both of which were intended to be the same but were not.
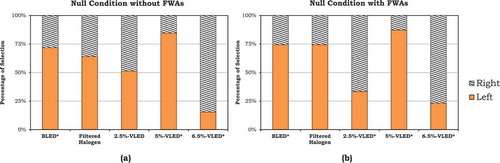
Fig. C1 Illustration of differences between booths during null-condition trials. The chromaticity coordinates of the one pair of whiteness standards used in forced choice (W81.9 versus W83.3) under the illumination of five lamps in the two booths. The solid points were measured in the right booth and the hollow points were measured in the left booth. The dashed line corresponds to the BB-470-nm line; the grey region represents tint values of ±3.
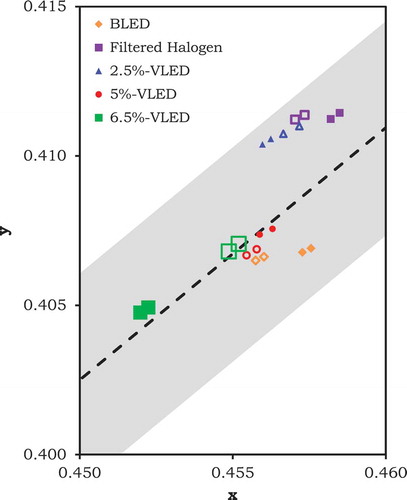
Fig. D1 New whiteness value of the standards under the illumination of the five lamps by using (D1), a whiteness formula with an adaptation to a 2850 K illuminant on blackbody locus. The dashed line shows the diagonal x = y. The standards under the filtered halogen and the three VLEDs show increased whiteness with CIE whiteness values. All of the standards have simliar whiteness under BLED. The trends corraborate the results from the forced-choice and selection experiments, when the observers were looking at the standards with mixed chromatic adaptation. The standards under 2.5%-VLED have similar whiteness values compared to those under the filtered halogen.