
Figures & data
Fig. 1 Schematic floor plan of virtual 3D space.
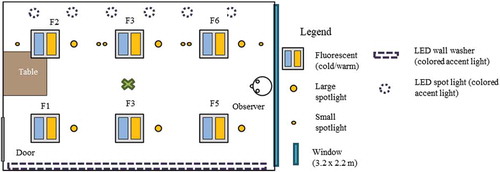
Table 1. Overview of light characteristics and luminance calculations of the light conditions. Michelson contrast was calculated by (Lmax − Lmin)/(Lmax + Lmin).
Fig. 2 Visualizations of the light conditions used in the experiments. The first column depicts all light conditions without daylight. The second column depicts the same light conditions in the presence of diffuse daylight. The third and fourth columns depict light condition 4 in the presence of two types of direct daylight.
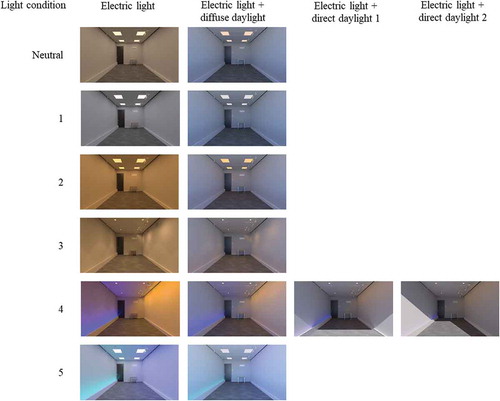
Fig. 3 This graph depicts luminance measurements of light condition 2 taken in the 40° high band in the real space on which the light effect in the visualization was based. Luminance measurements with and without diffuse daylight are depicted, where the y-axis presents the luminance (in cd/m2) and the x-axis presents the horizontal dimension of the 40° high band in the space. This figure has been published before in Stokkermans and others [Citation2015].
![Fig. 3 This graph depicts luminance measurements of light condition 2 taken in the 40° high band in the real space on which the light effect in the visualization was based. Luminance measurements with and without diffuse daylight are depicted, where the y-axis presents the luminance (in cd/m2) and the x-axis presents the horizontal dimension of the 40° high band in the space. This figure has been published before in Stokkermans and others [Citation2015].](/cms/asset/bed9e0ee-a6dc-403d-b9a9-c51f5cfe91f6/ulks_a_1385399_f0003_b.gif)
Table 2. Overview of atmosphere dimensions and their items.
Fig. 4 Schematic representation of the total effect model (shown at the top of the figure) and the mediation/moderation model (shown at the bottom of the figure). The total effect and mediation effects are indicated by solid lines and moderation effects with dashed lines.
Table 3. Cronbach’s alpha values for the four atmosphere attributes measured in experiments 1 and 2.
Fig. 5 Graph per measured attribute depicting the results of a random versus blocked presentation of the daylight conditions. Each data point represents the mean over all five electric light conditions with the error bar representing the 95% confidence interval.
Table 4. P-value and effect size (ηg2) per attribute for presenting the daylight conditions randomly versus blocked.
Fig. 6 Effect of paired-comparison versus rating-scale methodology. Each graph (per attribute) presents the mean score of the rating-scale methodology and the z-score of the paired-comparison methodology for all light conditions.
Table 5. Pearson correlation coefficient per attribute between the z-score per light condition resulting from the paired-comparison methodology and the mean score of each light condition resulting from the rating-scale methodology. Additionally, the median effect size ratio, or the effect size of the paired-comparison results divided by the effect size of the rating-scale results, is given for all attributes.
Table 6. Overview of the outcomes of the repeated-measures ANOVAs for the main and interaction effects of daylight and electric light condition.
Fig. 7 Effect of daylight on the light and atmosphere attributes for all light conditions. Error bars represent the 95% confidence interval. Asterisks indicate the daylight conditions that differ significantly (P < 0.05) from the no-daylight condition for that particular light condition and attribute.
Table 7. Results of the mediation analyses for the total effect of the independent measure electric light condition on the dependent measures coziness (C), liveliness (L), tenseness (T), and detachment (D). Regression coefficients are given for all combinations of electric light condition. An asterisk indicates a significant effect.
Fig. 8 Schematic representation of the results of the total effect analyses (top) and mediation/moderation analyses (bottom). An arrow is drawn if for one of the electric light condition comparisons a significant effect was found. The type of arrow (as indicated in the legend) indicates the number of significant effects that were found, where darker and thicker arrows represent a higher number of significant effects.
Table 8. Overview of the a-path effects of the mediation and moderation analyses: influence of the independent measure electric light condition with and without the impact of the moderator daylight on the mediators (that is, brightness (B), perceived color (Pc), and perceived uniformity (Pu)). Regression coefficients are given for all combinations of the electric light conditions (that is, 1 versus 2, et cetera). An asterisk indicates a significant effect.
Table 9. Overview of the b-path effects of the mediation and moderation analyses: influence of the mediators (that is, brightness (B), perceived color (Pc), and perceived uniformity (Pu)) with and without the impact of the moderator daylight on the dependent measures coziness, liveliness, tenseness, and detachment. Regression coefficients are given for all combinations of the electric light conditions (that is, 1 versus 2, et cetera). An asterisk indicates a significant effect.
Table 10. Overview of the c′-path effects of the mediation and moderation analyses: influence of independent measure electric light condition with and without the impact of the moderator daylight on the dependent measures coziness (C), liveliness (L), tenseness (T), and detachment (D). Regression coefficients are given for all combinations of electric light condition (that is, 1 versus 2, et cetera). An asterisk indicates a significant effect.