Publication Cover
LEUKOS
The Journal of the Illuminating Engineering Society
Volume 15, 2019 - Issue 2-3: Lighting Research Methods
4,554
Views
11
CrossRef citations to date
0
Altmetric
Articles

An Adjusted Error Score Calculation for the Farnsworth-Munsell 100 Hue Test

Pages 195-202 | Received 21 Feb 2018, Accepted 17 Aug 2018, Published online: 17 Apr 2019

Figures & data

Fig. 1. (Top) The distribution of caps of the FM-100 hue test in the ab′ plane of CAM02-UCS (using the CIE 1964 10° standard observer) illuminated by CIE standard illuminant C. The caps have an average lightness correlate (J′) of 60.15 and an average colorfulness correlate (M′) of 19.73 (Luo et al. Citation2006). The dashed circle shows an equal colorfulness of 19.73 across all hues. Number labels indicate cap number. (Bottom) Top view of the four physical test trays of the FM-100 test. Tray A has 22 moveable caps between two fixed end caps; trays B, C, and D have 21.

Fig. 1. (Top) The distribution of caps of the FM-100 hue test in the a′b′ plane of CAM02-UCS (using the CIE 1964 10° standard observer) illuminated by CIE standard illuminant C. The caps have an average lightness correlate (J′) of 60.15 and an average colorfulness correlate (M′) of 19.73 (Luo et al. Citation2006). The dashed circle shows an equal colorfulness of 19.73 across all hues. Number labels indicate cap number. (Bottom) Top view of the four physical test trays of the FM-100 test. Tray A has 22 moveable caps between two fixed end caps; trays B, C, and D have 21.

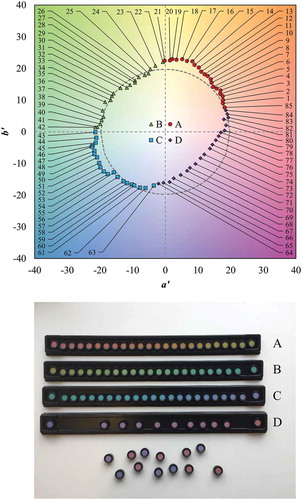
Table 1. Rd for select light sources from the library of the IES TM-30-15 calculator. Multiple spectra of the same source type sometimes exhibited different Rd values. For example, there were multiple phosphor-based LED sources in the library that collectively exhibited all Rd values between 0 and 28.

Fig. 2. (Top left) A generalized comparison of standard error score and adjusted error score. Point 1 indicates that the standard error score equals the adjusted error score (that is, ES = ESadj), which only occurs when a light source causes no cap transpositions (Rd = 0). Equation (1) assumes that the light source causes no cap transpositions and that all resulting participant error scores fall on the c = 1 line. For point 2, the adjusted error score is higher than a standard error score of zero (that is, ESadjES = 0), which occurs when a light source causes many transpositions and the participant orders his or her caps in exact numerical order; in this scenario, many errors would be uncounted using the standard error score calculation. For point 3, the standard error score is higher than an adjusted error score of zero (that is, ESESadj = 0), which occurs when the light source causes several transpositions and the participant exactly responds. In this scenario, errors are misapplied to the participant using the standard error score calculation because the correct order of caps is not the numerical order. (Top right/bottom left) Trays B and C error score comparison, respectively, for 480 responses (24 spectra × 20 participants) from Esposito and Houser (Citation2017). (Bottom right) Total error score comparison for the same study. Seventeen of their 24 experimental spectra caused at least one hue transposition, which resulted in a large overall discrepancy between TES and TESadj. It is clear that the assumption that all responses fall on the c = 1 line will result in significant error. Note that these panels are a new calculation from the data of Esposito and Houser (Citation2017).

Fig. 2. (Top left) A generalized comparison of standard error score and adjusted error score. Point 1 indicates that the standard error score equals the adjusted error score (that is, ES = ESadj), which only occurs when a light source causes no cap transpositions (Rd = 0). Equation (1) assumes that the light source causes no cap transpositions and that all resulting participant error scores fall on the c = 1 line. For point 2, the adjusted error score is higher than a standard error score of zero (that is, ESadj > ES = 0), which occurs when a light source causes many transpositions and the participant orders his or her caps in exact numerical order; in this scenario, many errors would be uncounted using the standard error score calculation. For point 3, the standard error score is higher than an adjusted error score of zero (that is, ES > ESadj = 0), which occurs when the light source causes several transpositions and the participant exactly responds. In this scenario, errors are misapplied to the participant using the standard error score calculation because the correct order of caps is not the numerical order. (Top right/bottom left) Trays B and C error score comparison, respectively, for 480 responses (24 spectra × 20 participants) from Esposito and Houser (Citation2017). (Bottom right) Total error score comparison for the same study. Seventeen of their 24 experimental spectra caused at least one hue transposition, which resulted in a large overall discrepancy between TES and TESadj. It is clear that the assumption that all responses fall on the c = 1 line will result in significant error. Note that these panels are a new calculation from the data of Esposito and Houser (Citation2017).

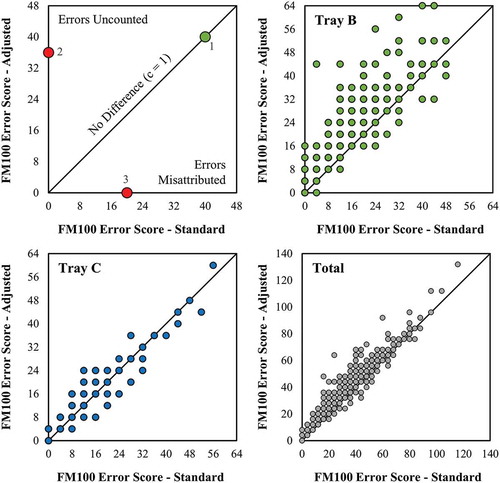
Table A1. Worked example where Rd = 0 and BES = 4.

Table A2. Worked example where Rd,B=4 and BESadj=4.

Supplemental material

Supplemental calculator

Download (1.6 MB)