
Figures & data
Fig. 1. Sketch of the (a) experiment setup and photos of the experiment setup with three different backgrounds: (b) white, (c) grey, and (d) black. (Painting reproduction courtesy of Leonid Afremov/www.afremov.com)
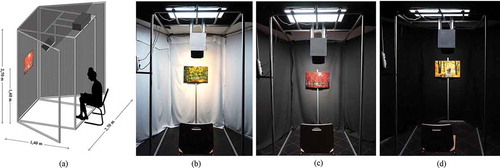
Table 1. Measured lighting characteristics for the various lighting configurations.
Fig. 2. Left: Spectra of ambient, fluorescent lighting (thick solid line) and tunable LED channels: white (dashed line), red (solid line), green (dashed-dotted line), and blue (dotted line). Right: Optimized spectra of the LED spotlight for the five different CCTs: 3000 K (solid line), 3500 K (dashed line), 4000 K (dashed-dotted line), 5000 K (dotted line), and 6000 K (thick solid line).
Fig. 3. Leonid Afremov’s paintings (2002–2016) used for the experiment: A: “When Dreams Come True”; B: “Mystery of the Night”; G: “Summer Forest”; R: “Pink Fog” ;and Y: “Happy Couple.”(Painting reproduction courtesy of Leonid Afremov/www.afremov.com)
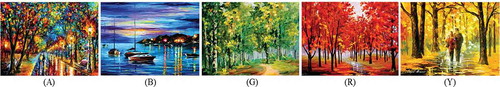
Fig. 4. Color distributions (a*b* and a*L*) of the five paintings illuminated by 3000 K (left graphs), 4000 K (middle graphs), and 6000 K (right graphs) spotlighting obtained using a calibrated camera. The colors of the plotted data denote the dominant hue of the painting: red: red painting; orange: yellow painting; green: green painting; blue: blue painting; and grey: all painting. The black squares are the mean colors of each distribution.
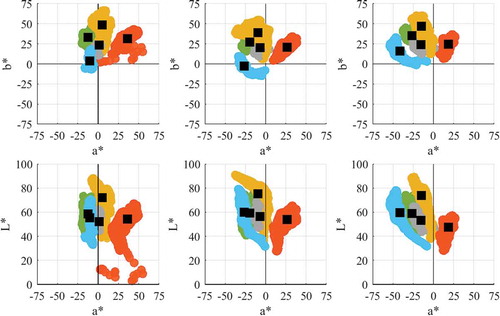
Fig. 5. Pictures of the red painting on the three backgrounds and under the five lighting configurations (from warmer light on the left to cooler light on the right).(Painting reproduction courtesy of Leonid Afremov/www.afremov.com)
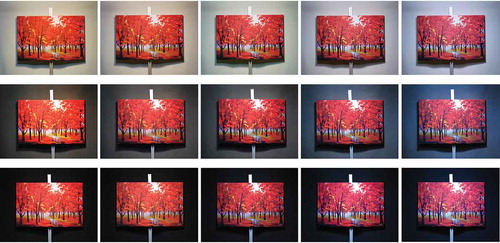
Table 2. Results for interobserver and intra-observer variability.
Table 3. Results for interobserver and intra-observer variability between naïve and expert observers.
Fig. 6. Average observer results as a function of the CCT for the painting “Pink Fog” (R), experiment A. The solid red lines, dashed blue lines, and dotted black lines represent respectively the results for the white, grey, and black backgrounds, and the bars represent the standard errors. (a) Overall appreciation, (b) background appreciation, (c) warmth, (d) brightness, (e) vividness, and (f) and color attractiveness.
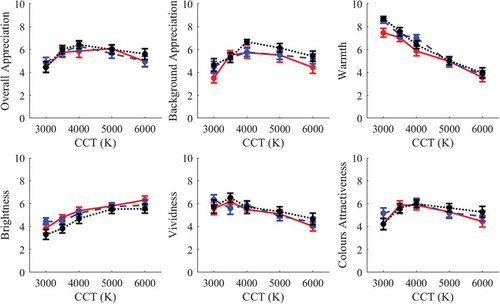
Table 4. Results of the ranking test for the most and least preferred lighting configurations. Values are the percentage of observers ranking a specific CCT as most/least preferred.
Fig. 7. Illustration of the effect of degree of adaptation on the color appearance of the 99 IES TM30-15 samples when illuminated by the 3000 K (red dots), 4000 K (yellow dots), and 6000 K (grey dots) spotlighting condition. Left: complete adaptation (D = 1); right: incomplete adaptation, respectively D = 0.1, 0.3, and 0.6.
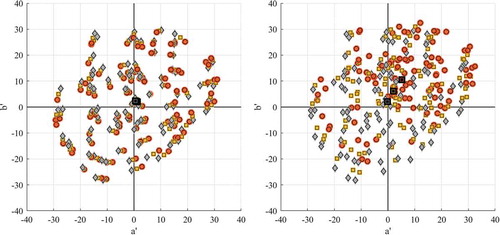
Fig. 8. Average observer results for experiment A (red dotted lines) and experiment B (blue dashed lines) as a function of the CCT for the painting “Pink Fog” (R): (a) overall appreciation, (b) warmth, and (c) brightness.
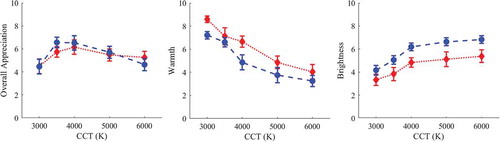
Table 5. Results of repeated measures ANOVAs for each of the quality factors.
Table 6. Scheffé scalings αi and yardsticks Ye of the three parts of the experiment on brightness.
Fig. 9. Results of relative perceived brightness (Q) for (a) test A, (b) test B, and (c) test C (circles and triangles represent respectively 3000 K and 4000 K). The error bars represent the yardstick values for each test.
Fig. A.1. Average observer results as a function of the CCT for the painting “When Dreams Come True” (A). The solid red lines, dashed blue lines, and dotted black lines represent respectively the results for the white, grey, and black backgrounds.
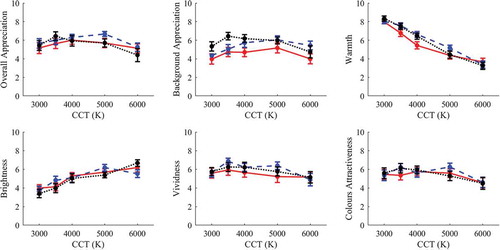
Fig. A.2. Average observer results as a function of the CCT for the painting “Mystery of the Night” (B). The solid red lines, dashed blue lines, and dotted black lines represent respectively the results for the white, grey, and black backgrounds.
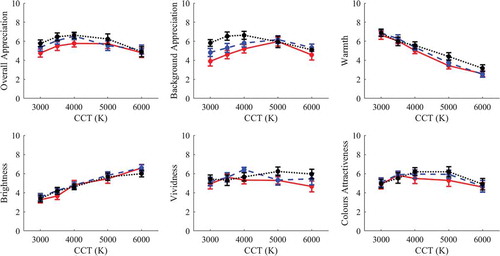
Fig. A.3. Average observer results as a function of the CCT for the painting “Summer Forest” (G). The solid red lines, dashed blue lines, and dotted black lines represent respectively the results for the white, grey, and black backgrounds.
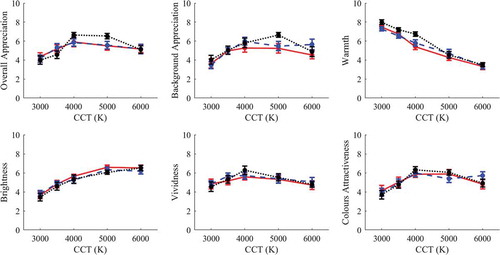
Fig. A.4. Average observer results as a function of the CCT for the painting “Happy Couple” (Y). The solid red lines, dashed blue lines, and dotted black lines represent respectively the results for the white, grey, and black backgrounds.
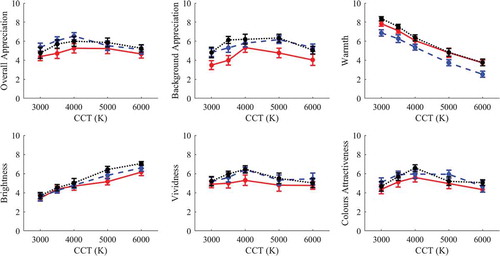
Table B.1. Values of geometric mean, standard error of the geometric mean, and median for all combinations of painting (A, G, B, R, Y)/background (W, G, B)/CCT (3000 K–6000 K).