Figures & data
Table 1. Limit values for driver’s eye illumination (IESNA Citation2000)
Table 2. Lighting requirements for intrusive outdoor lighting installations (IESNA Citation2000)
Table 3. Luminance levels for RPA (SANRAL Citation2000)
Fig. 1. Locations of luminance measurements of advertising media (from left: a) Gdańsk – Tczew – Gdańsk, b) Warsaw – Marki, c) Łomianki – Warszawa). Source: Own description
Fig. 2. Advertisements types (group A top left, group B top right, group C bottom left, group D bottom right). Source: Own description
Fig. 3. Measurement geometry for billboard luminance (Chrzanowicz and Tomczuk Citation2017; Chrzanowicz et al. Citation2017)
Fig. 4. Example of the measurement of the maximal luminance of a billboard with a 0.1° measuring field angle. Source: Own description
Fig. 5. Measurement fields of LT advertising luminance and LB background luminance as well as the location of the meter. Source: Own description
Fig. 6. Potential directions of medium observation and measurement (arrow length represents light value), a) the highest emission in the axis perpendicular to the medium, b) uniform and symmetrical emission, c) asymmetrical emission. Source: Own description
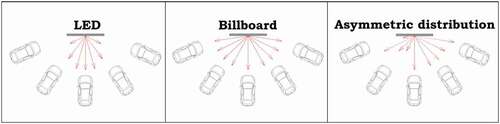
Table 4. Results of the measurements of lighting parameters of advertising media
Fig. 7. Frequency of maximum luminance of various types of advertising. Source: Own description
Fig. 8. Frequency of background luminance of various types of advertising. Source: Own description
Fig. 9. Frequency of contrast of various types of advertising. Source: Own description
Fig. 10. Frequency of area of various types of advertising. Source: Own description
Fig. 11. The values adopted in South Africa (SANRAL Citation2000) limiting the maximum allowed luminance on the advertising surface with marked limitations according to . The broken line indicates the luminance limitations for day and night time in Poland. Source: Own description
Fig. 12. Contrast of luminance for particular types of advertising, including the acceptable value C ≤ 40 (line). Source: Own description
Table 5. Lighting zones (CIE Citation2017; ILP Citation2015)
Table 6. The level of luminance depends on the surface of advertising medium (CIE Citation2017; ILP Citation2015)
Fig. 13. Examples of mounting a luminaire to illuminate an advertising medium