Figures & data
Table 1. Overview of studied factors and their levels
Fig. 1. The selected façade geometry variations (top row) and the corresponding examples of contemporary architecture they were based on (bottom row). Façade variations were manipulated to have the same perforation ratio. From left to right: [1] Faena Aleph Residences, Foster + Partners, Buenos Aires, Argentina, 2012; [2] Selcuk Ecza Headquarters, Tabanlıoglu Architects, Istanbul, Turkey, 2013; [3] Kew House, Piercy & Company, Richmond, United Kingdom, 2014; [4] Federation Square, Lab Architecture Studio, Melbourne, Australia, 2002.
![Fig. 1. The selected façade geometry variations (top row) and the corresponding examples of contemporary architecture they were based on (bottom row). Façade variations were manipulated to have the same perforation ratio. From left to right: [1] Faena Aleph Residences, Foster + Partners, Buenos Aires, Argentina, 2012; [2] Selcuk Ecza Headquarters, Tabanlıoglu Architects, Istanbul, Turkey, 2013; [3] Kew House, Piercy & Company, Richmond, United Kingdom, 2014; [4] Federation Square, Lab Architecture Studio, Melbourne, Australia, 2002.](/cms/asset/7b1f0da6-90ba-4ace-b967-9bcf3c3b73ed/ulks_a_1999257_f0001_b.gif)
Fig. 2. Perspective view representing a participant’s viewpoint in virtual reality in scenes with Pattern 1 and 2 for all context and sky type combinations. Note that there is a narrow west-facing window between the two ceiling levels. The difference in brightness of this window between different sky conditions in these images is caused by external reflections and the applied tone-mapping algorithms.
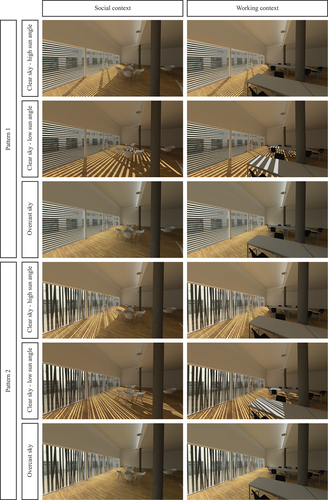
Table 2. Radiance material properties for the main surfaces
Table 3. Radiance simulation parameters
Table 4. Categories of stature, eye height, and corresponding participant height
Fig. 3. Perspective view representing a participant’s viewpoint in virtual reality in scenes with Pattern 3 and 4 for all context and sky type combinations.
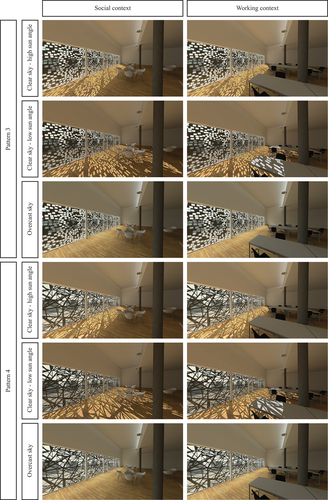
Table 5. Verbal questionnaire used in the study
Table 6. Demographic characteristics of participants in each country of study
Table 7. Distribution of sample size per country, spatial context, and sky type
Table 8. Results of the LMM analysis for the main factors of interest Country, Façade geometry, Spatial context, and Sky type on all dependent variables
Table 9. Marginal and conditional R2 of the LMM for each studied attribute
Table 10. Estimated marginal means (EMM), standard errors (SE), and 95% confidence intervals (CI) per attribute and country
Fig. 4. Estimated marginal means, standard deviations, and pairwise comparisons of reported brightness across countries. Asterisks represent statistical significance in the pairwise comparisons. The notation **** indicates p < .0001.
Table 11. Estimated marginal means (EMM), standard errors (SE), and 95% confidence intervals (CI) per attribute and façade geometry variation, color-coded from the lowest (white) to the highest (dark gray) mean. Results are averaged over the levels of the other factors in the LMM
Fig. 5. Estimated marginal means and standard error per country and per façade geometry variation for the attributes pleasant, interesting, exciting, and calming. Pairwise comparisons are shown between façade variations (averaged across levels of country, sky type, and context). Asterisks represent statistical significance in the pairwise comparisons: *** indicates p < .001 and **** indicates p < .0001.
Fig. 6. Estimated marginal means and standard error per country and per façade geometry variation for the attributes complex, bright, spacious, and satisfaction with the amount of view in the space. Pairwise comparisons are shown between façade variations (averaged across levels of country, sky type, and context). Asterisks represent statistical significance in the pairwise comparisons: *** indicates p < .001 and **** indicates p < .0001.