Figures & data
Fig. 1. Visualization of the three experimental lighting conditions and measurement protocol of one session. IL = intermittent light, BL = bright light, DL = dim light, Ass nr = assessment number.
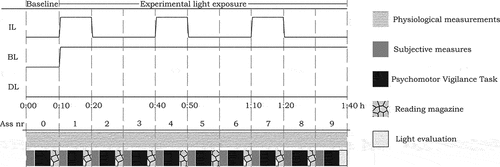
Fig. 3. Normalized spectral power distribution of the bright (solid line) and dim (dotted line) light settings.
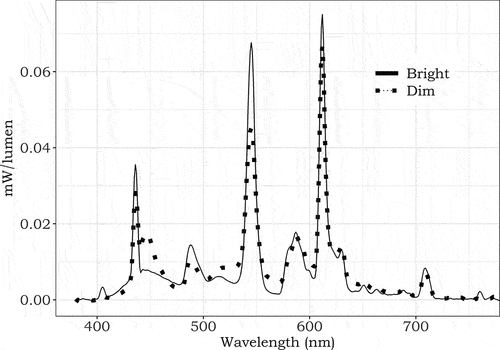
Table 1. Illuminance, CCT, Color fidelity index, α-opic EDI, and α-opic DER of the light settings (at the eye position).
Table 2. Upper (ΔU) and lower (ΔL) equivalence bounds that were used in the equivalence test for the alertness-related parameters.
Fig. 4. Temporal trajectory of a) vitality, b) sleepiness, c) mean reaction time for PVT, d) standard deviation for the PVT, e) mean reaction time for the 10% slowest responses of the PVT, f) coefficient of variation for the PVT, g) mean reaction time for the 10% fastest responses of the PVT, and h) PVT motivation. The graphs are based on the models without the correction for time in session. The error bars represent SE.
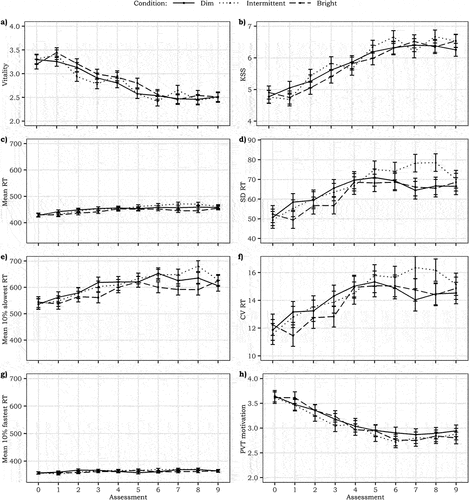
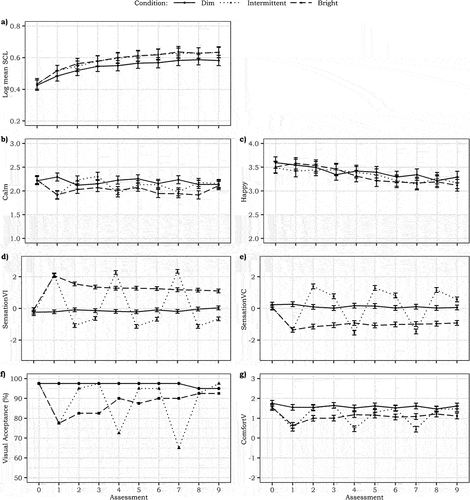
Fig. 5. Temporal trajectory of a) mean SCL, b) calm, c) happy, d) sensation of light intensity, e) sensation of color temperature, f) visual acceptance (in % – no statistical testing), and g) visual comfort. The graphs are based on the models without the correction for time in session. The error bars represent SE.
Supplemental Material
Download PDF (105.3 KB)Supplemental Material
Download PDF (128.6 KB)Supplemental Material
Download PDF (136.3 KB)Supplemental Material
Download PDF (99.6 KB)Data availability statement
The coded collected data is available to the general public in an online data repository (10.17605/OSF.IO/BSA9N).

