
Figures & data
Fig. 1. Diagram of the study protocol. Blue color indicates questionnaires, orange color indicates cognitive tests. Green indicates physiological measures. Tasks were completed in the order in which they are listed. PVT = psychomotor vigilance task - measures vigilance; NLT = number letter task – measures cognitive flexibility; PASAT = paced auditory serial addition task – measures attention and information processing speed; 2-back = working memory task – measures working memory capacity; PANAS = positive and negative affect scale – measures mood state; T1 = first measurement; T2 = second measurement; T3 = third measurement.
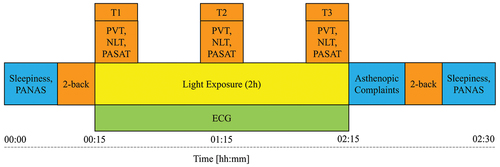
Fig. 2. Screenshot of the desktop user interface to personalize workplace lighting.
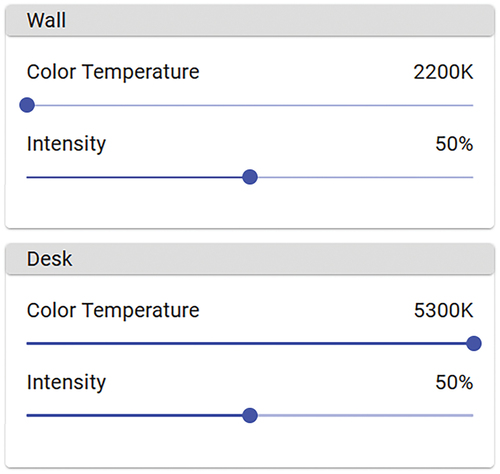
Fig. 3. Workplace lighting situation during the control condition (5300 K).
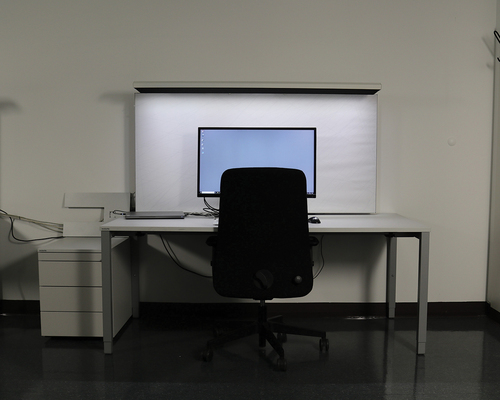
Table 1. Light settings under personalized lighting and the control condition. α-opic measurements were taken at eye level. CCT = correlated color Temperature; EDI = equivalent daylight illuminance.
Fig. 4. Melanopic EDIs (equivalent daylight illuminance) for each participant under personalized lighting. The dashed line indicates the melanopic EDI of the control condition (= 86 lx). The triangle in the violin plot signifies the mean EDI under personalized lighting.
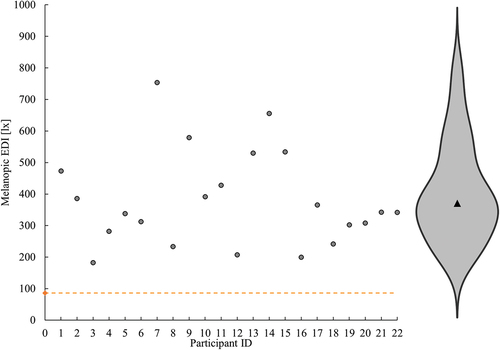
Fig. 5. Scatter plot for self-selected CCTs (correlated color temperature). The dotted line indicates equal CCTs at the desk and the wall.
Table 2. Sleepiness, affect, and working memory. Data are mean ± standard deviation; PANAS = positive and negative affect Schedule; pre = before light exposure; post = after light exposure.
Fig. 6. Changes in the PANAS (positive and negative affect schedule) positive affect ratings over time. Pre = before light exposure; post = after light exposure.
Table 3. Vigilance, task switching, sustained attention, and information processing performance during light exposure. Reaction speed is 1/reaction time. T1 = first measurement; T2 = second measurement; T3 = third measurement; SD = standard deviation; IQR = interquartile range. PVT = psychomotor vigilance Test; NLT = number letter Task; PASAT = paced auditory serial addition task.
Fig. 7. Reaction speed in the number letter task (NLT) for non-switch trials (left) and switch trials (right). T1 = first measurement; T2 = second measurement; T3 = third measurement.
Table 4. Summary of significant results. a = partial Eta squared; b = Wilcoxon’s r; c = Kendall’s W; no significant results were observed in subjective sleepiness and negative affect (PANAS) ratings, working memory (2-back task) and vigilance (PVT). PANAS = positive and negative affect Schedule; NLT = number letter Task; PASAT = paced auditory serial addition task.
Table 5. Descriptive statistics on heart rate (HR) and pNN50. Pre = measurement before light exposure; post = measurement after light exposure; T1 = first measurement; T2 = second measurement; T3 = third measurement. PVT = psychomotor vigilance Task; NLT = number letter Task; PASAT = paced auditory serial addition task.
Table 6. ANOVA test statistics including post-hoc tests for the main effect of measurement time on heart rate (HR) and pNN50. T1 = first measurement; T2 = second measurement; T3 = third measurement. Only two measurements exist for the 2-back and breaks, no post-hoc tests were calculated for these data. ‘negative‘ indicates a decrease of heart rate, “positive” indicates an increase in pNN50.