Figures & data
Fig. 1. Solar penumbra (a) and pinhole projection (b) effects.
Fig. 2. Radiance’s deterministic ray tracing algorithm without (a) and with direct jittering set to 0.6 (b) and 1.0 (c).
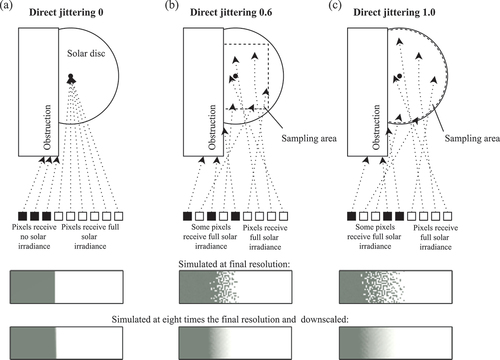
Fig. 3. Three Radiance-based simulation approaches to generate solar penumbras and pinhole projections.
Table 1. Parameters used for simulations in Radiance rpict for each simulation approach.
Fig. 4. Overview of the method to validate each of the three Radiance-based simulation approaches for generating solar penumbras and pinhole projections against real-world measurements.
Fig. 5. Measurement setup to capture various solar penumbras and pinhole projections.
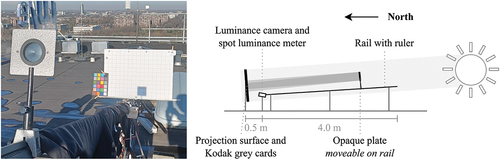
Table 2. Measured material properties (red, green, and blue reflectances) of objects of and near the experimental setup.
Table 3. Radiance rpict parameters for validating the simulation model.
Fig. 6. Validation of the simulation model for predicting mean luminances. (a) The used areas in the simulated and measured HDR images to compute the mean luminances. (b) Agreement between the thirty-six measured and simulated mean luminances. The line of equality is indicated by a dashed line. (c) The measured and simulated mean luminances for each position on the rail.
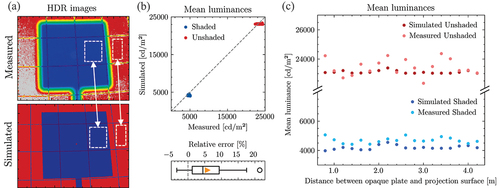
Fig. 7. Computing penumbra lengths from HDR images by extracting pixel luminances (a) and grid positions (b), fitting an equation (c), and taking the length corresponding to 90% of the luminance difference (d). The location of the line from which pixel luminances were extracted is indicated by a white line in panel (a).
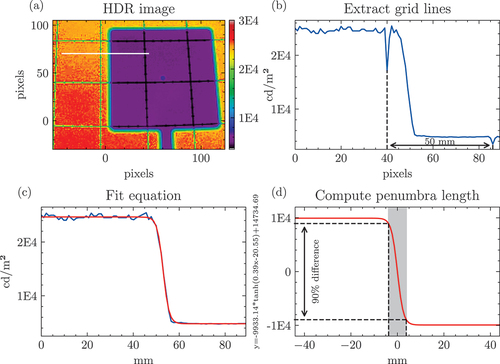
Fig. 8. Measured and simulated HDR images of an opaque plate with a circular opening at 1.6 m from the projection surface.
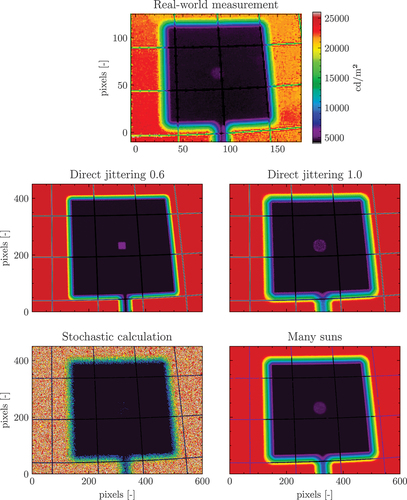
Fig. 9. Measured and simulated (using three simulation approaches) solar penumbra lengths across different distances between the opaque plate and the projection surface.
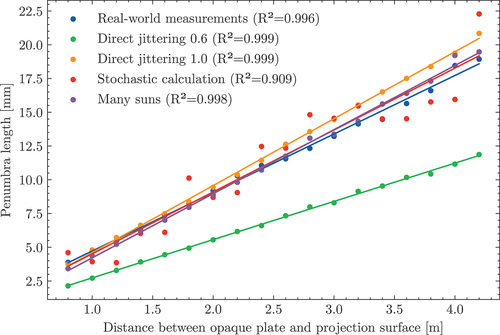
Table 4. Relative mean bias errors () and relative root mean square errors (
) of penumbra length and pinhole projection diameter comparing simulations using three Radiance-based approaches against real-world measurements.
Fig. 10. Grey shaded images of real-world and simulated, using three approaches, solar pinhole projections. The pinhole projections result from an opaque plate with a circular pinhole (diameter 2.31 mm) at various distances from the projection surface.
Fig. 11. Grey shaded images of real-world and simulated, using three approaches, solar pinhole projections. The pinhole projections result from an opaque plate with a square pinhole (5 by 5 mm) at various distances from the projection surface.
Fig. 12. Measured and simulated (using two simulation approaches) solar pinhole projection diameters shown across different distances between the opaque plate with a square opening and the projection surface.
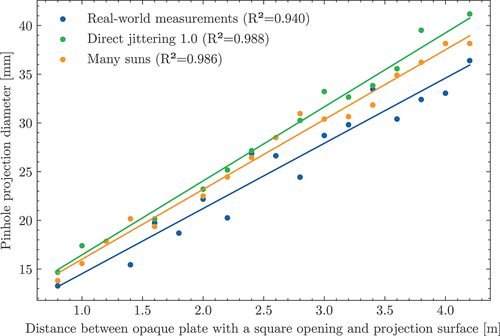
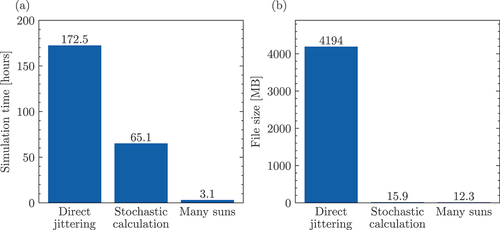
Fig. 13. Simulation times (a) and file sizes (b) for reference case simulations using the three Radiance-based approaches.