1,572
Views
0
CrossRef citations to date
0
Altmetric
Research Article

Fluctuations in food and fluid intake during a 24-h World Championship: analysis of the deviation from nutritional programs

ORCID Icon, , ORCID Icon, ORCID Icon, &
Pages 92-109 | Received 30 Dec 2021, Accepted 30 Jan 2022, Published online: 30 Mar 2022

Figures & data

Figure 1. Individual race individual. M: man, W: woman, WR: world record.

Figure 1. Individual race individual. M: man, W: woman, WR: world record.

Figure 1. (Continued).

Figure 1. (Continued).

Table 1. List of foods and fluids consumed by participants

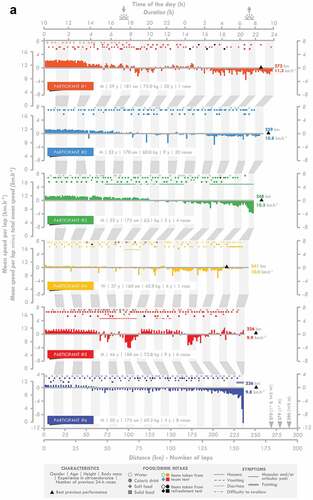
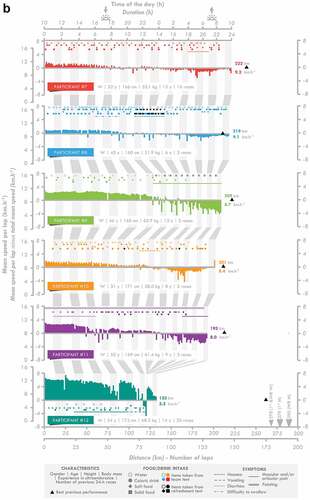
Table 2. Evolution of environmental variables, pacing, instances of consumption, and intake per lap during the race

Figure 2. Temporal evolution of absolute intake during the 24-h race. Bold lines indicate the means, the filled colored bars the standard deviations, and the dotted lines the maximal and minimal values.

Figure 2. Temporal evolution of absolute intake during the 24-h race. Bold lines indicate the means, the filled colored bars the standard deviations, and the dotted lines the maximal and minimal values.

Figure 3. Temporal evolution of the degree of convergence from the expected energy and total fluid intake. Vertical bars indicate the means and the lines the individual evolution. *Significant difference between the two linked 6-h periods. One symbol: p < 0.05, two symbols: p < 0.01, three symbols: p < 0.001.

Figure 3. Temporal evolution of the degree of convergence from the expected energy and total fluid intake. Vertical bars indicate the means and the lines the individual evolution. *Significant difference between the two linked 6-h periods. One symbol: p < 0.05, two symbols: p < 0.01, three symbols: p < 0.001.

Figure 4. Occurrences and duration of gastrointestinal symptoms during the 24-h race.

Figure 4. Occurrences and duration of gastrointestinal symptoms during the 24-h race.

Figure 5. Individual and mean responses to the pre- and post-race questionnaires. Vertical black bars indicate the mean values and colored squares indicate individual answers.

Figure 5. Individual and mean responses to the pre- and post-race questionnaires. Vertical black bars indicate the mean values and colored squares indicate individual answers.