
Figures & data
Figure 1. Study participant enrollment and randomization into vitamin D3 and placebo supplementation groups.
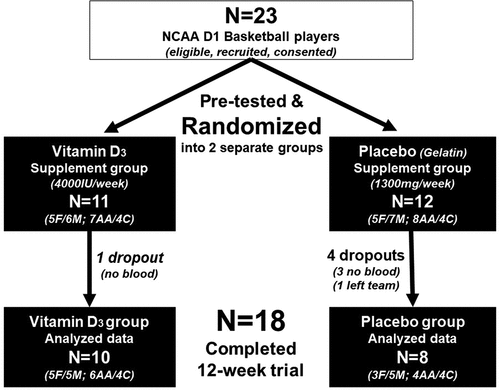
Figure 2. Vitamin D3 and placebo supplement group comparisons over time (pre- to post-intervention) for 25(OH)D (2a), bone mineral density (BMD)(2b), total body fat percent (2c), and total body lean mass (2d).
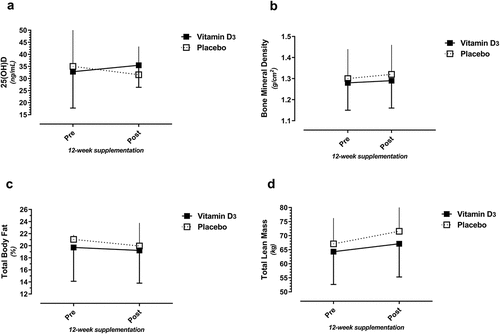
Table 1. Demographics, peak power, and dietary intake variables in basketball players randomized into the vitamin D supplement and placebo groups. F = female athletes. Δ = post minus pre intervention
Figure 3. Relationships between total dietary vitamin D3 intake vs. 25(OH)D (3a; pre- and post-intervention); 25(OH)D vs. the change (Δ) in fat mass (3b; pre- and post-intervention); and the change (Δ) in 25(OH)D vs. pre-intervention 25(OH)D levels (3c; randomized into the placebo or vitamin D3 supplement group). All change (Δ) values represent post-intervention minus pre-intervention.
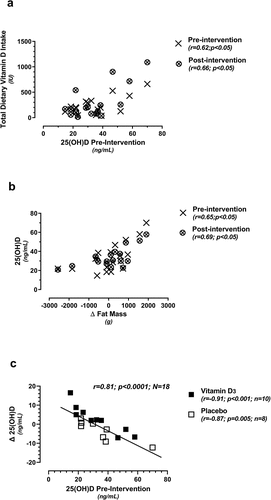
Table 2. Differences in 25(OH)D, body composition, and dietary intake between African American and Caucasian players. F = female athletes. Δ = post minus pre-intervention
Figure 4. Relationships between total body bone mineral density (BMD) vs. sweat [Na+] (a), total dietary sodium intake (b), and total dietary calcium intake (c), and between sweat [Na+] vs. total dietary sodium intake (d) obtained at pre-intervention (baseline) testing.
![Figure 4. Relationships between total body bone mineral density (BMD) vs. sweat [Na+] (a), total dietary sodium intake (b), and total dietary calcium intake (c), and between sweat [Na+] vs. total dietary sodium intake (d) obtained at pre-intervention (baseline) testing.](/cms/asset/5dc35f56-216e-4888-99b2-8ca65e9c4a45/rssn_a_2046444_f0004_b.gif)