Figures & data
Figure 1. HIIE performance expressed as a number of FINA points at baseline and day 10 of intervention between randomization arms. Data are given as means ± SD and compared by paired Student’s t-test for within-group comparison analysis and by Student’s t-test for independent data for between-group comparison analysis. n = 10 per group. **** – p < 0.0001; * – p < 0.05; ns – not significant (p > 0.05).
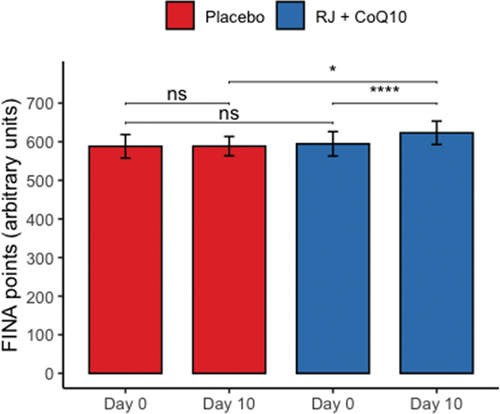
Table 1. Plasmatic and salivary biomarkers of oxidative stress and muscle damage before and immediately after high-intensity interval exercise at baseline and day 10 of intervention between randomization arms.
Figure 2. Generalized pairs plot, including density plot, scatter plot, and correlation matrix, for displaying distribution and relationship between the changes in plasmatic and salivary DC, SB, and CK levels under HIIE conditions in both intervention groups. n = 10 per group. *** – p < 0.001; ** – p < 0.01. Abbreviations: Corr, Pearson’s correlation coefficient for both groups; Placebo, Pearson’s correlation coefficient for PLA group; RJ + CoQ10, Pearson’s correlation coefficient for RJQ group; DC, diene conjugates; SB, Schiff bases; CK, creatine kinase.
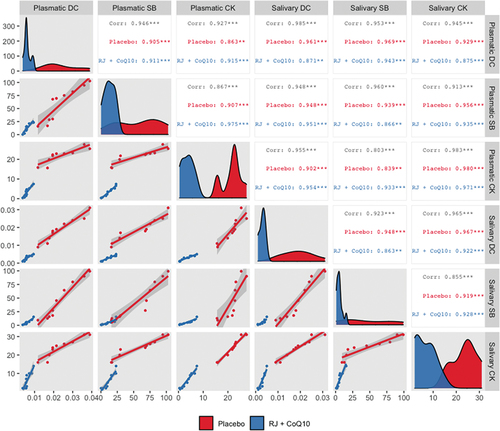
Table 2. Modeling the effects of 10-day RJQ supplementation on changes in plasmatic and salivary biomarkers of oxidative stress and muscle damage in response to high-intensity interval exercise.
Figure 3. Principal component analysis applied to changes in RJQ-dependent variables in both plasma and saliva under HIIE conditions. n = 10 per group. PC1, principal component 1; PC2, principal component 2; DC, diene conjugates; SB, Schiff bases; CK, creatine kinase.
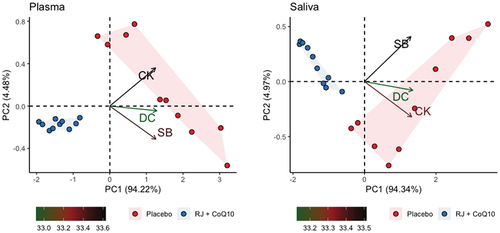
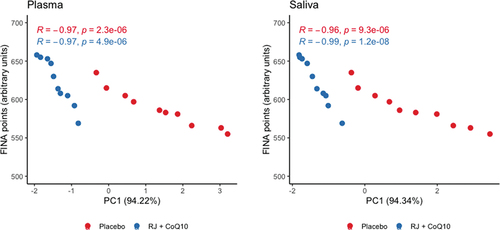
Figure 4. Scattergram of plasmatic and salivary PC1 values and the number of FINA points scored by swimmers during HIIE in both intervention groups. n = 10 per group. PC1, principal component 1; R, Pearson’s correlation coefficient; p, p-value.