Figures & data
Figure 1. Macronutrient content of commercially available whey proteins is higher than reported per 100 g of product. (a) Calorie (kcal), (b) carbohydrate (g), (c) fat, and (d) protein. *p < 0.05, **p < 0.01, paired t-test. Values expressed as mean.
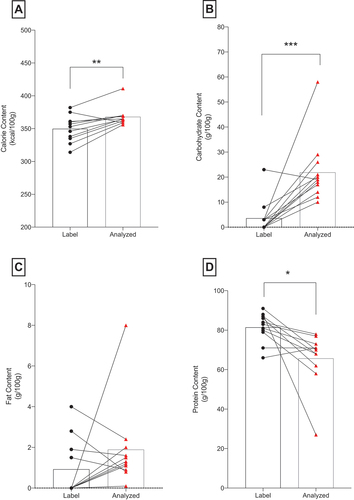
Figure 2. Whey proteins contain altered macronutrient content per suggested portion. (a) Calorie (kcal), (b) carbohydrate (g), (c) fat, and (d) protein. *p < 0.05, **p < 0.01, paired t-test. Values expressed as mean.
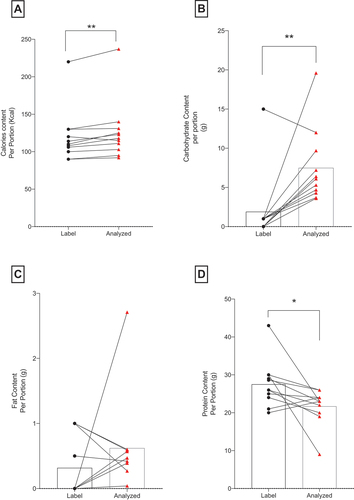
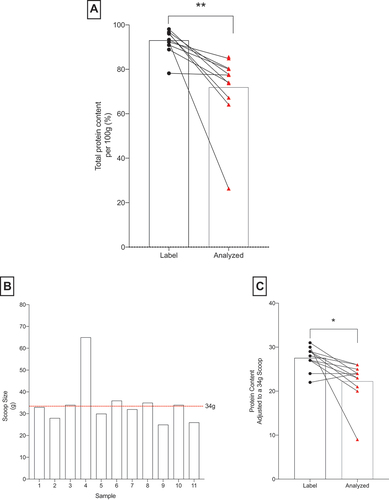
Figure 3. Protein content labeled on available commercially whey proteins is less than measured. (a) Percentage of protein content per 100 g product, (b) differences in Scoop sizes, (c) protein content adjusted to an average of the samples (34 g scoop size). *p < 0.05, **p < 0.01. Paired t-test. Values expressed as mean. Dotted red line (–) represents the average scoop of available whey proteins considered in the study.