Figures & data
Figure 1. Study design of the pilot study 2018 (A) and the intervention study 2019 − 2020 (B). T0, begin, T1, after 10-/12-weeks, T2, after 10-month, DBS, dried blood spot, BIA, bioelectrical impedance analysis, FFQ, food frequency questionnaire, HRM, high-resolution melting, SNP, single nucleotide polymorphism.
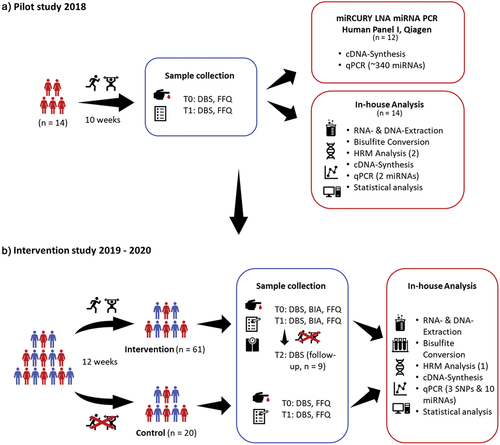
Table 1. Results of the analyzed markers of the participants of the sports intervention group. Results were given in mean ± SD.
Figure 2. Fitness/Ω score of the intervention group (n, 61) and the control group (n, 20) before [T0] and after [T1]. *Shows significant p-values (paired t-test).
![Figure 2. Fitness/Ω score of the intervention group (n, 61) and the control group (n, 20) before [T0] and after [T1]. *Shows significant p-values (paired t-test).](/cms/asset/807dc422-f23d-4281-bf71-b8b688912a3c/rssn_a_2106148_f0002_oc.jpg)
Table 2. Distribution of the SNPs in the FTO (rs1121980), ACE (rs4341), and ACTN3 (rs1815739) gene. Genotyping values are given in total numbers and as a percentage.
Figure 3. Fold changes of the selected miRNAs by genotype. A) Fold change of miR-101-3p by ACE genotype (GG strength, CC endurance). B) Fold change of miR-20a-5p by ACTN3 genotype (CC strength, TT endurance). C) Fold change of miR-22-5p by ACTN3 genotype (CC strength, TT endurance). D) Fold change of miR-101-3p by ACTN3 genotype (CC strength, TT endurance). E) Fold change of miR-22-5p by FTO genotype (AA risk variant). The p-values given here are the results of the post hoc tests (Scheffé). * Shows significant p-values.
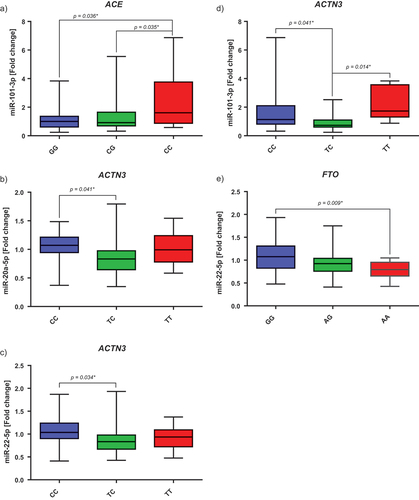
Table 3. Body composition changes through the 12-week sports intervention. Anthropometric measurements were given in mean ± SD.
Figure 4. Significant correlations between the change of the anthropometric data and the expression of selected miRNAs, the fitness/Ω score, and Line-1 methylation after the Intervention [T1]. A) Correlation between the change of LBM and the expression of miR-22-5p at T1. B) Correlation between the change of BFM and the expression of miR-505-3p at T1. C) Correlation between the change of LBM and the expression of miR-101-3p at T1. D) Correlation between the change of BFM and the fitness/Ω score at T1. E) Correlation between the change of ECW and the Line-1 methylation at T1. Statistical significance was defined as a p-value below 0.05.
![Figure 4. Significant correlations between the change of the anthropometric data and the expression of selected miRNAs, the fitness/Ω score, and Line-1 methylation after the Intervention [T1]. A) Correlation between the change of LBM and the expression of miR-22-5p at T1. B) Correlation between the change of BFM and the expression of miR-505-3p at T1. C) Correlation between the change of LBM and the expression of miR-101-3p at T1. D) Correlation between the change of BFM and the fitness/Ω score at T1. E) Correlation between the change of ECW and the Line-1 methylation at T1. Statistical significance was defined as a p-value below 0.05.](/cms/asset/94fb2066-3352-4ce3-b691-973cffbad4b7/rssn_a_2106148_f0004_b.gif)
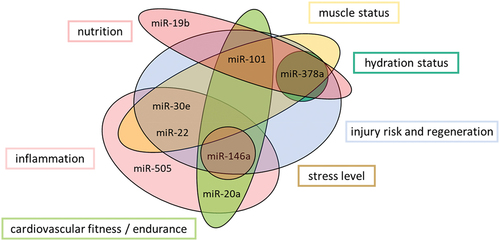
Figure 5. The properties of the measured miRNAs and their importance and classification as sports-relevant biomarkers.